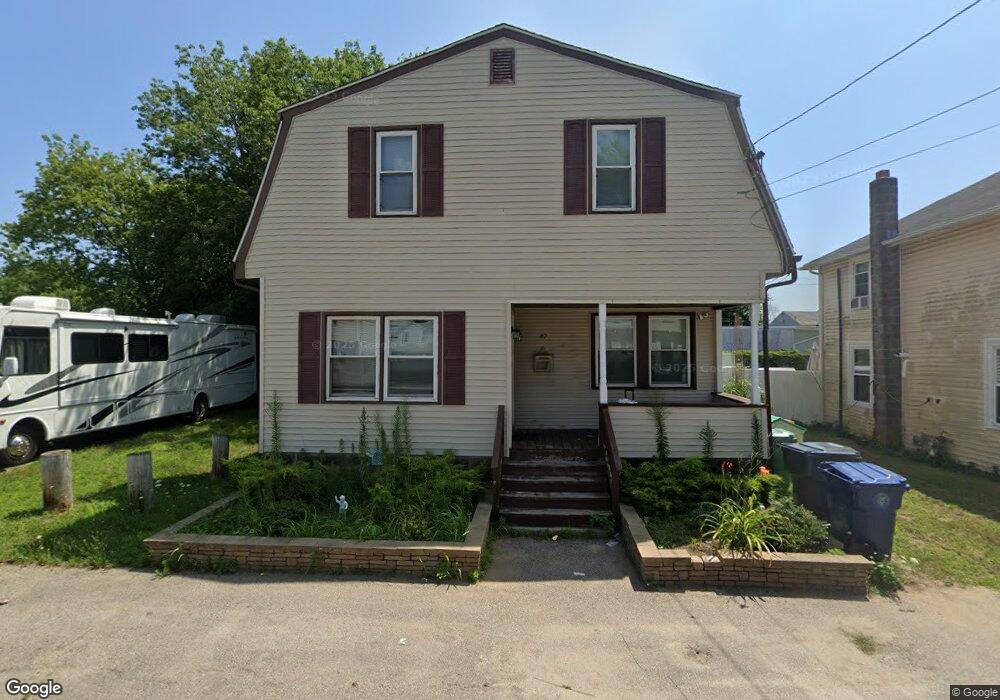
80 Sagamore St Warwick, RI 02889
Oakland Beach NeighborhoodEstimated Value: $388,434 - $452,000
3
Beds
2
Baths
2,260
Sq Ft
$188/Sq Ft
Est. Value
About This Home
This home is located at 80 Sagamore St, Warwick, RI 02889 and is currently estimated at $424,359, approximately $187 per square foot. 80 Sagamore St is a home located in Kent County with nearby schools including Saint Kevin School and Bishop Hendricken High School.
Ownership History
Date
Name
Owned For
Owner Type
Purchase Details
Closed on
Oct 27, 2010
Sold by
Seavey 2Nd Jonathan C
Bought by
Seavey Jonathan C and Seavey Cynthia
Current Estimated Value
Purchase Details
Closed on
Mar 20, 2008
Sold by
Diangeto Janet
Bought by
Seavey Jonathan C
Home Financials for this Owner
Home Financials are based on the most recent Mortgage that was taken out on this home.
Original Mortgage
$180,800
Interest Rate
5.75%
Mortgage Type
Purchase Money Mortgage
Purchase Details
Closed on
Oct 12, 2007
Sold by
Morequity Inc
Bought by
Diangelo Janet
Home Financials for this Owner
Home Financials are based on the most recent Mortgage that was taken out on this home.
Original Mortgage
$185,000
Interest Rate
13.5%
Purchase Details
Closed on
Oct 21, 2005
Sold by
Raflery Richard A and Raflery Cynthia
Bought by
Cotton John M
Create a Home Valuation Report for This Property
The Home Valuation Report is an in-depth analysis detailing your home's value as well as a comparison with similar homes in the area
Home Values in the Area
Average Home Value in this Area
Purchase History
| Date | Buyer | Sale Price | Title Company |
|---|---|---|---|
| Seavey Jonathan C | $178,800 | -- | |
| Seavey Jonathan C | $226,000 | -- | |
| Diangelo Janet | $160,000 | -- | |
| Cotton John M | $296,250 | -- |
Source: Public Records
Mortgage History
| Date | Status | Borrower | Loan Amount |
|---|---|---|---|
| Previous Owner | Cotton John M | $180,800 | |
| Previous Owner | Cotton John M | $185,000 |
Source: Public Records
Tax History Compared to Growth
Tax History
| Year | Tax Paid | Tax Assessment Tax Assessment Total Assessment is a certain percentage of the fair market value that is determined by local assessors to be the total taxable value of land and additions on the property. | Land | Improvement |
|---|---|---|---|---|
| 2024 | $4,248 | $293,600 | $70,900 | $222,700 |
| 2023 | $4,166 | $293,600 | $70,900 | $222,700 |
| 2022 | $3,791 | $202,400 | $40,300 | $162,100 |
| 2021 | $3,791 | $202,400 | $40,300 | $162,100 |
| 2020 | $3,791 | $202,400 | $40,300 | $162,100 |
| 2019 | $3,791 | $202,400 | $40,300 | $162,100 |
| 2018 | $3,251 | $156,300 | $37,400 | $118,900 |
| 2017 | $3,164 | $156,300 | $37,400 | $118,900 |
| 2016 | $3,164 | $156,300 | $37,400 | $118,900 |
| 2015 | $3,397 | $163,700 | $46,400 | $117,300 |
| 2014 | $3,284 | $163,700 | $46,400 | $117,300 |
| 2013 | $3,240 | $163,700 | $46,400 | $117,300 |
Source: Public Records
Map
Nearby Homes
- 84 Sagamore St
- 74 Sagamore St
- 81 Sagamore St
- 70 Sagamore St
- 75 Sagamore St
- 89 Sagamore St
- 153 Suburban Pkwy
- 66 Sagamore St
- 163 Suburban Pkwy
- 771 Oakland Beach Ave
- 82 Oniska St
- 167 Suburban Pkwy
- 76 Oniska St
- 65 Sagamore St
- 62 Sagamore St
- 90 Oniska St
- 74 Oniska St
- 171 Suburban Pkwy
- 68 Oniska St
- 61 Sagamore St