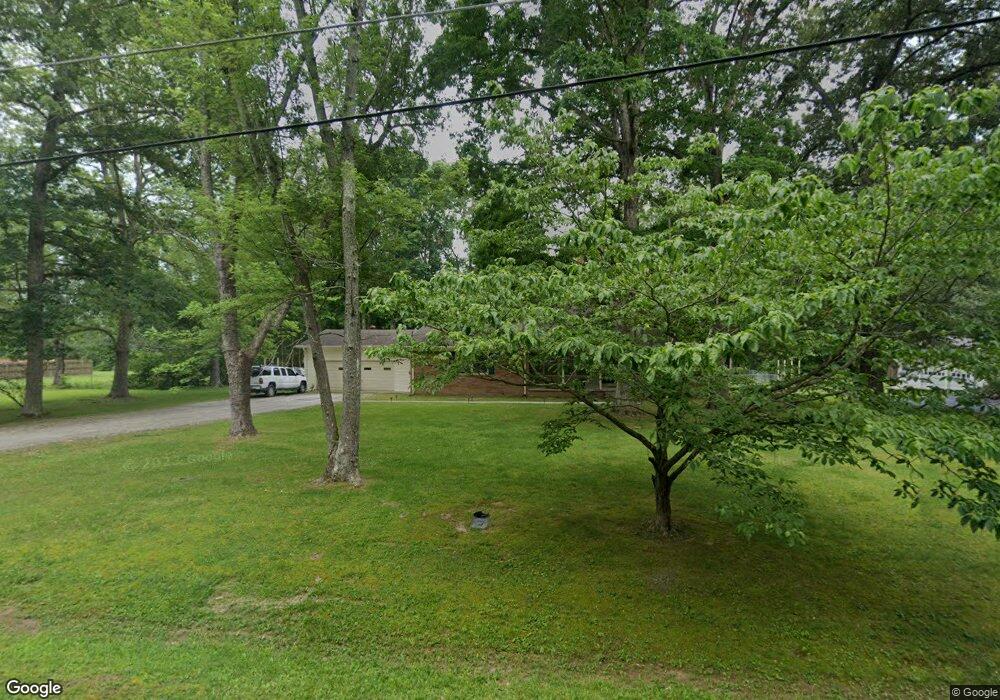
80 Shaw Cir Manchester, TN 37355
Estimated Value: $249,249 - $391,000
--
Bed
2
Baths
2,644
Sq Ft
$129/Sq Ft
Est. Value
About This Home
This home is located at 80 Shaw Cir, Manchester, TN 37355 and is currently estimated at $339,812, approximately $128 per square foot. 80 Shaw Cir is a home located in Coffee County with nearby schools including Westwood Middle School and Temple Baptist Christian School.
Ownership History
Date
Name
Owned For
Owner Type
Purchase Details
Closed on
Jun 24, 2022
Sold by
Olton Ii Ronald T
Bought by
Brinkley Clinton S and Brinkley Jessica D
Current Estimated Value
Home Financials for this Owner
Home Financials are based on the most recent Mortgage that was taken out on this home.
Original Mortgage
$133,000
Outstanding Balance
$126,528
Interest Rate
5.25%
Mortgage Type
New Conventional
Estimated Equity
$213,284
Purchase Details
Closed on
Jul 25, 2007
Sold by
White Edward G
Bought by
Olton Ronald T
Purchase Details
Closed on
Jan 1, 1984
Bought by
White Edward G & Lind American City Bank
Create a Home Valuation Report for This Property
The Home Valuation Report is an in-depth analysis detailing your home's value as well as a comparison with similar homes in the area
Home Values in the Area
Average Home Value in this Area
Purchase History
| Date | Buyer | Sale Price | Title Company |
|---|---|---|---|
| Brinkley Clinton S | $140,000 | Gateway Title Services | |
| Olton Ronald T | $155,000 | -- | |
| White Edward G & Lind American City Bank | $67,500 | -- |
Source: Public Records
Mortgage History
| Date | Status | Borrower | Loan Amount |
|---|---|---|---|
| Open | Brinkley Clinton S | $133,000 |
Source: Public Records
Tax History Compared to Growth
Tax History
| Year | Tax Paid | Tax Assessment Tax Assessment Total Assessment is a certain percentage of the fair market value that is determined by local assessors to be the total taxable value of land and additions on the property. | Land | Improvement |
|---|---|---|---|---|
| 2024 | $2,080 | $49,350 | $4,700 | $44,650 |
| 2023 | $2,080 | $49,350 | $0 | $0 |
| 2022 | $1,791 | $49,350 | $4,700 | $44,650 |
| 2021 | $1,747 | $38,150 | $3,750 | $34,400 |
| 2020 | $1,747 | $38,150 | $3,750 | $34,400 |
| 2019 | $1,747 | $38,150 | $3,750 | $34,400 |
| 2018 | $1,747 | $38,150 | $3,750 | $34,400 |
| 2017 | $1,786 | $34,050 | $3,750 | $30,300 |
| 2016 | $1,786 | $34,050 | $3,750 | $30,300 |
| 2015 | $1,786 | $34,050 | $3,750 | $30,300 |
| 2014 | $1,786 | $34,057 | $0 | $0 |
Source: Public Records
Map
Nearby Homes