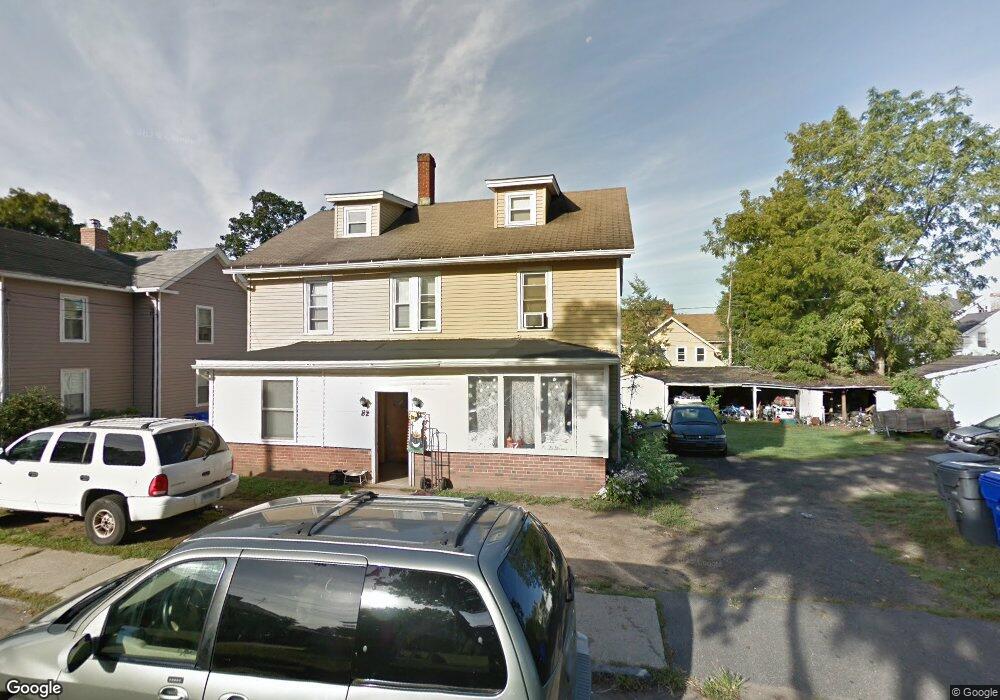
80 Spring St Enfield, CT 06082
Estimated Value: $242,000 - $304,000
7
Beds
3
Baths
1,848
Sq Ft
$146/Sq Ft
Est. Value
About This Home
This home is located at 80 Spring St, Enfield, CT 06082 and is currently estimated at $269,799, approximately $145 per square foot. 80 Spring St is a home located in Hartford County with nearby schools including Enfield Street Elementary School, Edgar H. Parkman School, and Enfield High School.
Ownership History
Date
Name
Owned For
Owner Type
Purchase Details
Closed on
Oct 26, 2011
Sold by
Peck James
Bought by
J Knapp Llc
Current Estimated Value
Purchase Details
Closed on
Mar 17, 2011
Sold by
Knapp Llc
Bought by
Peck James
Home Financials for this Owner
Home Financials are based on the most recent Mortgage that was taken out on this home.
Original Mortgage
$130,500
Interest Rate
4.84%
Purchase Details
Closed on
Dec 22, 2004
Sold by
Alexander Jeffrey
Bought by
Peek James and Peck Lynn
Home Financials for this Owner
Home Financials are based on the most recent Mortgage that was taken out on this home.
Original Mortgage
$129,600
Interest Rate
5.74%
Purchase Details
Closed on
Aug 9, 2002
Sold by
Mathewson Rachelle
Bought by
Alexander Jeffrey
Purchase Details
Closed on
Mar 26, 1993
Sold by
Jenkins Richard and Jenkins James
Bought by
Jenkins Charles
Create a Home Valuation Report for This Property
The Home Valuation Report is an in-depth analysis detailing your home's value as well as a comparison with similar homes in the area
Home Values in the Area
Average Home Value in this Area
Purchase History
| Date | Buyer | Sale Price | Title Company |
|---|---|---|---|
| J Knapp Llc | -- | -- | |
| Peck James | -- | -- | |
| Peek James | $162,000 | -- | |
| Alexander Jeffrey | $32,666 | -- | |
| Alexander Jeffrey | $65,333 | -- | |
| Jenkins Charles | $20,000 | -- |
Source: Public Records
Mortgage History
| Date | Status | Borrower | Loan Amount |
|---|---|---|---|
| Previous Owner | Jenkins Charles | $130,500 | |
| Previous Owner | Jenkins Charles | $129,600 | |
| Previous Owner | Jenkins Charles | $32,400 |
Source: Public Records
Tax History
| Year | Tax Paid | Tax Assessment Tax Assessment Total Assessment is a certain percentage of the fair market value that is determined by local assessors to be the total taxable value of land and additions on the property. | Land | Improvement |
|---|---|---|---|---|
| 2025 | $5,226 | $140,100 | $40,000 | $100,100 |
| 2024 | $5,086 | $140,100 | $40,000 | $100,100 |
| 2023 | $5,086 | $140,100 | $40,000 | $100,100 |
| 2022 | $4,712 | $140,100 | $40,000 | $100,100 |
| 2021 | $4,470 | $108,780 | $33,090 | $75,690 |
| 2020 | $4,426 | $108,780 | $33,090 | $75,690 |
| 2019 | $4,462 | $108,780 | $33,090 | $75,690 |
| 2018 | $4,365 | $108,780 | $33,090 | $75,690 |
| 2017 | $4,326 | $108,780 | $33,090 | $75,690 |
| 2016 | $4,437 | $113,190 | $33,090 | $80,100 |
| 2015 | $4,327 | $113,190 | $33,090 | $80,100 |
| 2014 | $4,118 | $113,190 | $33,090 | $80,100 |
Source: Public Records
Map
Nearby Homes
- 69 Prospect St
- 47 Maple Ave
- 80 S River St
- 41 Walnut St
- 57 Asnuntuck St
- 40 Church St
- 242 Pearl St
- 147 W Grayling Ln
- 30-32 Church St
- 26-28 Church St
- 24 Ohear Ave
- 24 Pebblestone Cir Unit 24
- 3 Pebblestone Cir Unit 3
- 97 Pleasant St
- 15 Summer St
- 148 Pleasant St
- 4 Pebblestone Cir
- 42 Hartford Ave
- 45 Douglas St
- 54 Hartford Ave
Your Personal Tour Guide
Ask me questions while you tour the home.