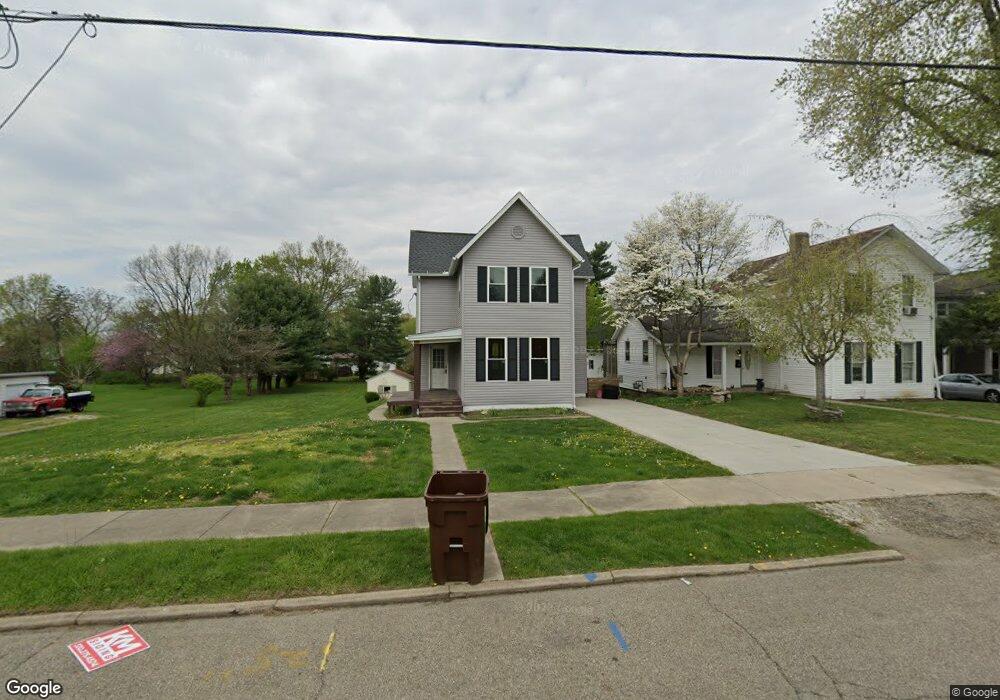
80 Summit St Newark, OH 43055
Estimated Value: $131,000 - $209,000
3
Beds
1
Bath
1,617
Sq Ft
$112/Sq Ft
Est. Value
About This Home
This home is located at 80 Summit St, Newark, OH 43055 and is currently estimated at $180,517, approximately $111 per square foot. 80 Summit St is a home located in Licking County with nearby schools including Ben Franklin Elementary School, Heritage Middle School, and Newark High School.
Ownership History
Date
Name
Owned For
Owner Type
Purchase Details
Closed on
Oct 4, 2022
Sold by
Breault Phillip L
Bought by
Vaubel Kyle and Vaubel Allie
Current Estimated Value
Purchase Details
Closed on
Sep 23, 2020
Sold by
Chapman Gary M
Bought by
Breault Phillip L
Purchase Details
Closed on
May 1, 2018
Sold by
Chapman Gary M
Bought by
Chapman Gary M
Purchase Details
Closed on
Sep 17, 2008
Sold by
Hud
Bought by
Chapman Gary M
Home Financials for this Owner
Home Financials are based on the most recent Mortgage that was taken out on this home.
Original Mortgage
$76,594
Interest Rate
6.55%
Mortgage Type
FHA
Purchase Details
Closed on
Feb 15, 2008
Sold by
Brannon Candase A and Brannon Graham A
Bought by
Hud
Purchase Details
Closed on
Feb 7, 2003
Sold by
Hicks Billy R
Bought by
Brannon Graham A and Brannon Candase A
Home Financials for this Owner
Home Financials are based on the most recent Mortgage that was taken out on this home.
Original Mortgage
$88,979
Interest Rate
6.01%
Mortgage Type
FHA
Create a Home Valuation Report for This Property
The Home Valuation Report is an in-depth analysis detailing your home's value as well as a comparison with similar homes in the area
Home Values in the Area
Average Home Value in this Area
Purchase History
| Date | Buyer | Sale Price | Title Company |
|---|---|---|---|
| Vaubel Kyle | -- | -- | |
| Breault Phillip L | $20,000 | None Available | |
| Chapman Gary M | -- | -- | |
| Chapman Gary M | $54,810 | Lakeside Title & Escrow Agen | |
| Hud | $59,000 | None Available | |
| Brannon Graham A | $89,900 | -- |
Source: Public Records
Mortgage History
| Date | Status | Borrower | Loan Amount |
|---|---|---|---|
| Previous Owner | Chapman Gary M | $76,594 | |
| Previous Owner | Brannon Graham A | $88,979 |
Source: Public Records
Tax History
| Year | Tax Paid | Tax Assessment Tax Assessment Total Assessment is a certain percentage of the fair market value that is determined by local assessors to be the total taxable value of land and additions on the property. | Land | Improvement |
|---|---|---|---|---|
| 2024 | $2,056 | $57,540 | $8,610 | $48,930 |
| 2023 | $404 | $10,990 | $8,610 | $2,380 |
| 2022 | $698 | $7,000 | $5,040 | $1,960 |
| 2021 | $300 | $7,000 | $5,040 | $1,960 |
| 2020 | $306 | $7,000 | $5,040 | $1,960 |
| 2019 | $917 | $20,450 | $3,610 | $16,840 |
| 2018 | $923 | $0 | $0 | $0 |
| 2017 | $1,042 | $0 | $0 | $0 |
| 2016 | $1,236 | $0 | $0 | $0 |
| 2015 | $1,262 | $0 | $0 | $0 |
| 2014 | $1,624 | $0 | $0 | $0 |
| 2013 | $1,203 | $0 | $0 | $0 |
Source: Public Records
Map
Nearby Homes
Your Personal Tour Guide
Ask me questions while you tour the home.