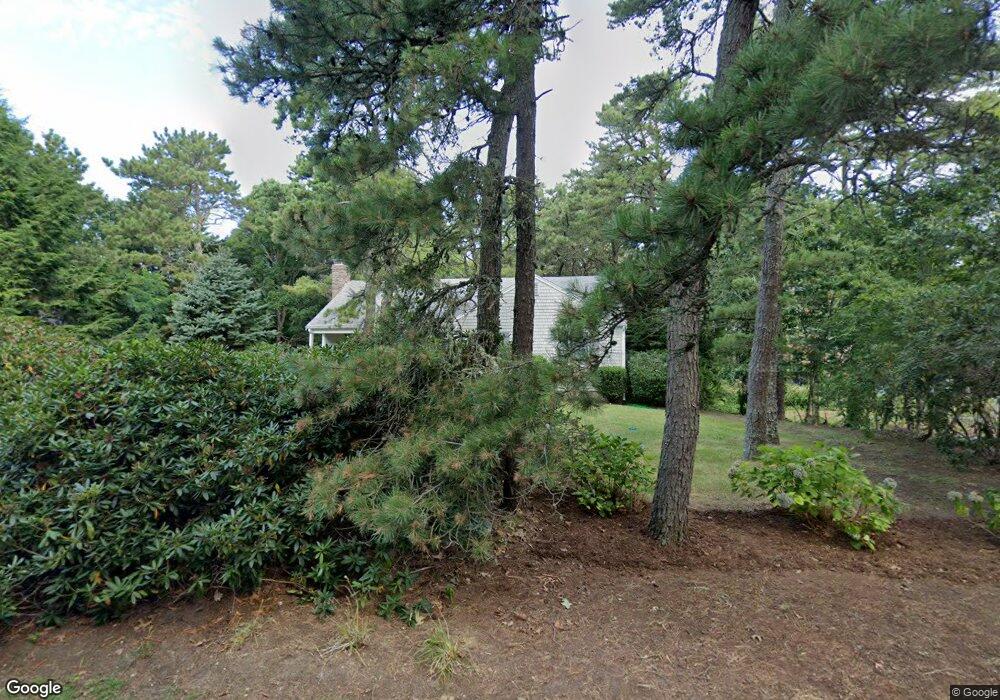
80 Surrey Ln Brewster, MA 02631
Estimated Value: $657,000 - $814,000
3
Beds
2
Baths
1,240
Sq Ft
$579/Sq Ft
Est. Value
About This Home
This home is located at 80 Surrey Ln, Brewster, MA 02631 and is currently estimated at $718,088, approximately $579 per square foot. 80 Surrey Ln is a home located in Barnstable County with nearby schools including Stony Brook Elementary School, Eddy Elementary School, and Nauset Regional Middle School.
Ownership History
Date
Name
Owned For
Owner Type
Purchase Details
Closed on
Oct 29, 2010
Sold by
Boink N Donald
Bought by
Hermansen Robert and Hermansen Jeanie
Current Estimated Value
Home Financials for this Owner
Home Financials are based on the most recent Mortgage that was taken out on this home.
Original Mortgage
$267,200
Outstanding Balance
$177,370
Interest Rate
4.39%
Mortgage Type
Purchase Money Mortgage
Estimated Equity
$540,718
Purchase Details
Closed on
May 22, 1992
Sold by
Magelaner Louis R and Magelaner Beverly G
Bought by
Boink N Donald and Boink Evelyn W
Create a Home Valuation Report for This Property
The Home Valuation Report is an in-depth analysis detailing your home's value as well as a comparison with similar homes in the area
Home Values in the Area
Average Home Value in this Area
Purchase History
| Date | Buyer | Sale Price | Title Company |
|---|---|---|---|
| Hermansen Robert | $334,000 | -- | |
| Boink N Donald | $130,000 | -- |
Source: Public Records
Mortgage History
| Date | Status | Borrower | Loan Amount |
|---|---|---|---|
| Open | Hermansen Robert | $267,200 | |
| Previous Owner | Boink N Donald | $40,000 |
Source: Public Records
Tax History
| Year | Tax Paid | Tax Assessment Tax Assessment Total Assessment is a certain percentage of the fair market value that is determined by local assessors to be the total taxable value of land and additions on the property. | Land | Improvement |
|---|---|---|---|---|
| 2025 | $4,125 | $599,600 | $253,900 | $345,700 |
| 2024 | $4,025 | $591,000 | $260,300 | $330,700 |
| 2023 | $3,694 | $528,400 | $232,400 | $296,000 |
| 2022 | $3,490 | $444,600 | $193,600 | $251,000 |
| 2021 | $3,326 | $387,600 | $168,300 | $219,300 |
| 2020 | $3,150 | $365,400 | $154,800 | $210,600 |
| 2019 | $2,965 | $345,600 | $142,500 | $203,100 |
| 2018 | $2,804 | $339,500 | $142,500 | $197,000 |
| 2017 | $2,634 | $313,900 | $142,500 | $171,400 |
| 2016 | $2,506 | $297,300 | $127,000 | $170,300 |
| 2015 | $2,402 | $290,800 | $124,500 | $166,300 |
Source: Public Records
Map
Nearby Homes
Your Personal Tour Guide
Ask me questions while you tour the home.