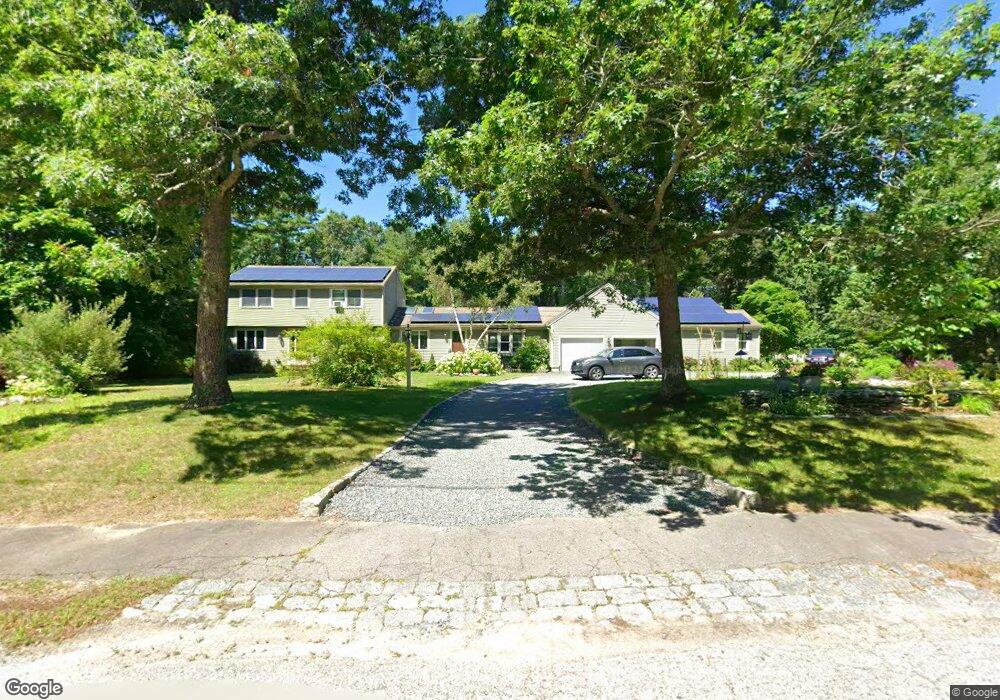
80 Tilden Rd Marshfield, MA 02050
Estimated Value: $996,000 - $1,133,079
10
Beds
4
Baths
3,757
Sq Ft
$289/Sq Ft
Est. Value
About This Home
This home is located at 80 Tilden Rd, Marshfield, MA 02050 and is currently estimated at $1,086,020, approximately $289 per square foot. 80 Tilden Rd is a home located in Plymouth County with nearby schools including Martinson Elementary School, Furnace Brook Middle School, and Marshfield High School.
Ownership History
Date
Name
Owned For
Owner Type
Purchase Details
Closed on
Mar 28, 2014
Sold by
Schulders Johanna M
Bought by
Roberts Rock B and Roberts Pamela G
Current Estimated Value
Purchase Details
Closed on
Jan 2, 2009
Sold by
Roberts Rock B and Roberts Pamela G
Bought by
Schulders Johanna M
Purchase Details
Closed on
Jun 4, 2001
Sold by
Grable Nt and Grable William G
Bought by
Roberts Rocka B and Roberts Pamela C
Create a Home Valuation Report for This Property
The Home Valuation Report is an in-depth analysis detailing your home's value as well as a comparison with similar homes in the area
Home Values in the Area
Average Home Value in this Area
Purchase History
We collect this data history from publicly available records. To have your information removed, we recommend requesting removal directly through your county’s website.
| Date | Buyer | Sale Price | Title Company |
|---|---|---|---|
| Roberts Rock B | -- | -- | |
| Schulders Johanna M | -- | -- | |
| Roberts Rocka B | $300,000 | -- |
Source: Public Records
Mortgage History
We collect this data history from publicly available records. To have your information removed, we recommend requesting removal directly through your county’s website.
| Date | Status | Borrower | Loan Amount |
|---|---|---|---|
| Previous Owner | Roberts Rocka B | $289,000 |
Source: Public Records
Tax History
| Year | Tax Paid | Tax Assessment Tax Assessment Total Assessment is a certain percentage of the fair market value that is determined by local assessors to be the total taxable value of land and additions on the property. | Land | Improvement |
|---|---|---|---|---|
| 2025 | $10,758 | $1,086,700 | $352,300 | $734,400 |
| 2024 | $10,488 | $1,009,400 | $337,000 | $672,400 |
| 2023 | $10,095 | $899,400 | $312,500 | $586,900 |
| 2022 | $10,095 | $779,500 | $277,300 | $502,200 |
| 2021 | $9,641 | $730,900 | $277,300 | $453,600 |
| 2020 | $8,851 | $664,000 | $255,500 | $408,500 |
| 2019 | $8,585 | $641,600 | $255,500 | $386,100 |
| 2018 | $8,478 | $634,100 | $255,500 | $378,600 |
| 2017 | $8,295 | $604,600 | $255,500 | $349,100 |
| 2016 | $7,988 | $575,500 | $255,500 | $320,000 |
| 2015 | $7,551 | $568,200 | $255,500 | $312,700 |
| 2014 | $7,695 | $579,000 | $255,500 | $323,500 |
Source: Public Records
Map
Nearby Homes
- 848 Plain St Unit 28
- 848 Plain St Unit 32
- 3 Proprietors Dr Unit 7
- 2 Proprietors Dr Unit 25
- 2 Proprietors Dr Unit 27
- 8 Royal Dane Dr Unit 71
- 267 Sandy Hill Dr
- 24 Proctor St
- 180 Plain St
- 25 Lynn St
- 121 Hampstead Way
- 160 Hillcrest Rd
- 35 Pokanoket Ln
- 31 Hillcrest Dr
- 286 North St
- 1670 Main St
- 60 Oakleaf Dr
- 965 Temple St
- 480 Pleasant St
- 3 Harlow Brook Way Unit 3
Your Personal Tour Guide
Ask me questions while you tour the home.