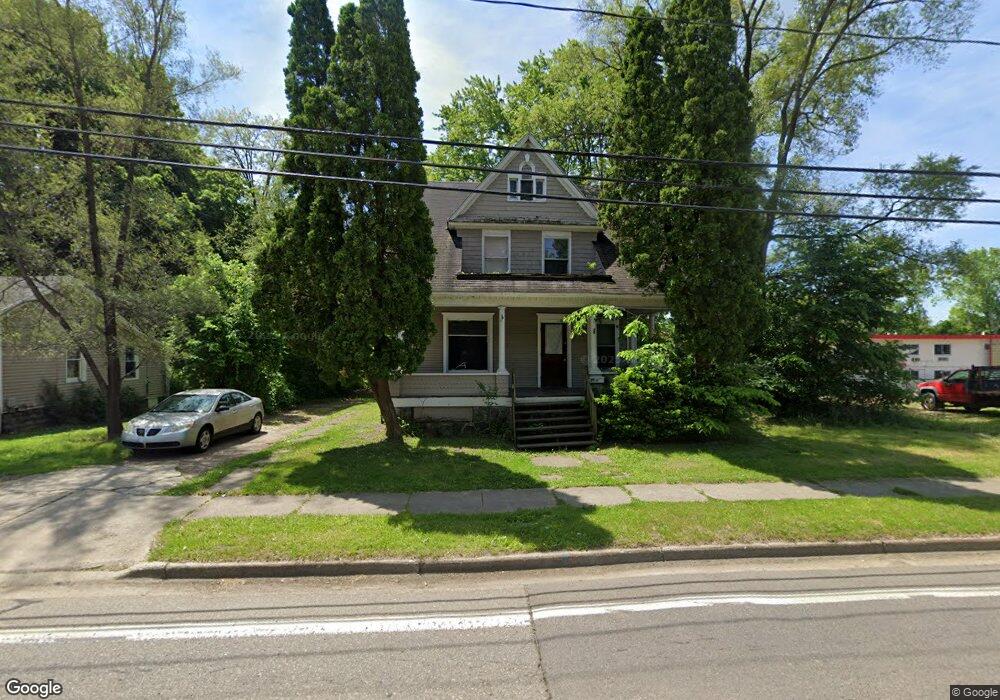
80 Van Buren St E Battle Creek, MI 49017
Northeast Battle Creek NeighborhoodEstimated Value: $81,000 - $114,000
4
Beds
2
Baths
1,700
Sq Ft
$55/Sq Ft
Est. Value
About This Home
This home is located at 80 Van Buren St E, Battle Creek, MI 49017 and is currently estimated at $93,483, approximately $54 per square foot. 80 Van Buren St E is a home located in Calhoun County with nearby schools including Verona Elementary School, Northwestern Middle School, and Battle Creek Central High School.
Ownership History
Date
Name
Owned For
Owner Type
Purchase Details
Closed on
Dec 16, 2013
Sold by
Evans James R and Evans Georgelyn S
Bought by
Winnie Howard E
Current Estimated Value
Purchase Details
Closed on
Mar 11, 2003
Sold by
Evans James R and Evans Geogelyn S
Bought by
Winnie Howard E
Purchase Details
Closed on
Feb 4, 2003
Sold by
Bent Joseph R
Bought by
Evans James R
Purchase Details
Closed on
Apr 7, 1995
Sold by
Evans James R and Evans Georgelyn S
Bought by
Bent Joseph R and Bent Sherry M
Create a Home Valuation Report for This Property
The Home Valuation Report is an in-depth analysis detailing your home's value as well as a comparison with similar homes in the area
Home Values in the Area
Average Home Value in this Area
Purchase History
| Date | Buyer | Sale Price | Title Company |
|---|---|---|---|
| Winnie Howard E | $15,000 | None Available | |
| Winnie Howard E | $15,000 | -- | |
| Evans James R | -- | -- | |
| Bent Joseph R | $26,000 | -- |
Source: Public Records
Tax History Compared to Growth
Tax History
| Year | Tax Paid | Tax Assessment Tax Assessment Total Assessment is a certain percentage of the fair market value that is determined by local assessors to be the total taxable value of land and additions on the property. | Land | Improvement |
|---|---|---|---|---|
| 2025 | -- | $35,700 | $0 | $0 |
| 2024 | $836 | $29,728 | $0 | $0 |
| 2023 | $1,064 | $27,105 | $0 | $0 |
| 2022 | $756 | $22,488 | $0 | $0 |
| 2021 | $1,011 | $20,566 | $0 | $0 |
| 2020 | $999 | $20,359 | $0 | $0 |
| 2019 | $991 | $17,051 | $0 | $0 |
| 2018 | $991 | $14,720 | $597 | $14,123 |
| 2017 | $1,079 | $19,588 | $0 | $0 |
| 2016 | $1,076 | $18,518 | $0 | $0 |
| 2015 | $1,055 | $21,908 | $2,620 | $19,288 |
| 2014 | $1,055 | $16,413 | $2,620 | $13,793 |
Source: Public Records
Map
Nearby Homes
- 174 Cherry St
- 162 Calhoun St
- 286 Capital Ave NE
- 119 Calhoun St
- 61 Rose St
- 122 North Ave
- 25 Orchard Place
- 114 Fremont St
- 49 Merritt St
- 31 Orchard Place
- 74 Union St S
- 28 Orchard Place
- 19 Central St
- 16 Eagle St
- 85 Mckinley Ave S
- 91 Sherman Rd
- 14 Elizabeth St
- 323 Garfield Ave
- 45 Central St
- 390 E Michigan Ave
- 86 Van Buren St E
- 74 Van Buren St E
- 75 Van Buren St E
- 87 Van Buren St E
- 93 Van Buren St E
- 98 Van Buren St E
- 100 Van Buren St E
- 63 Van Buren St E
- 104 Van Buren St E
- 110 Van Buren St E
- 64 Cherry St
- 54 Cherry St
- 126 Division St N
- 76 Cherry St
- 52 Cherry St
- 113 Van Buren St E
- 84 Cherry St
- 115 Van Buren St E
- 119 Van Buren St E
- 92 Cherry St