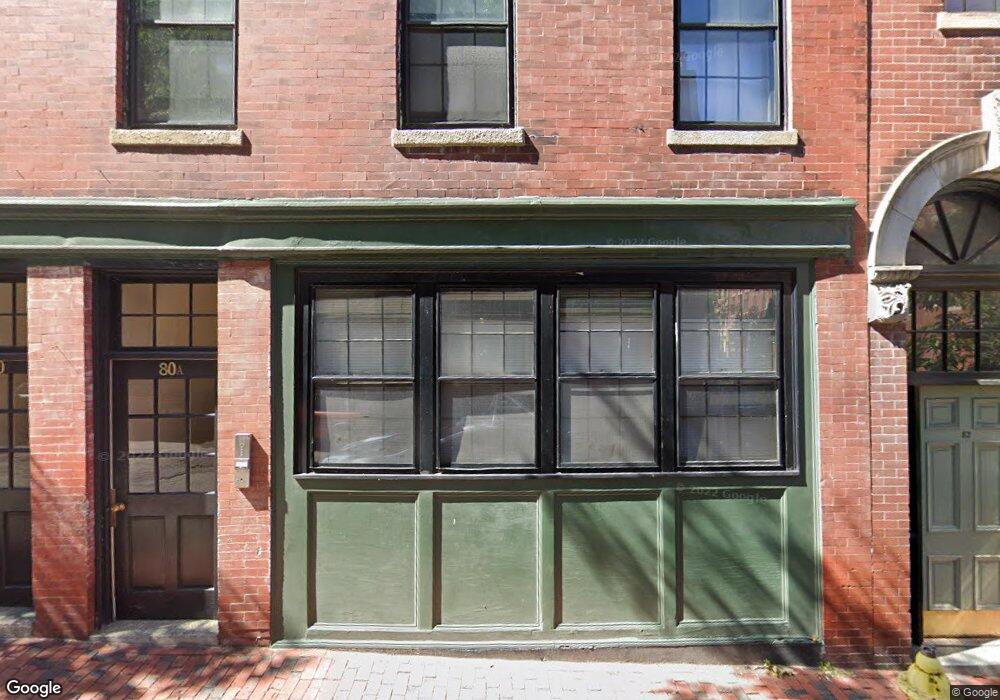
80 West Cedar St Unit 2 Boston, MA 02114
Beacon Hill NeighborhoodEstimated Value: $584,000 - $640,000
1
Bed
1
Bath
545
Sq Ft
$1,127/Sq Ft
Est. Value
About This Home
This home is located at 80 West Cedar St Unit 2, Boston, MA 02114 and is currently estimated at $614,411, approximately $1,127 per square foot. 80 West Cedar St Unit 2 is a home located in Suffolk County with nearby schools including Torit Montessori School, Advent School, and Park Street School.
Ownership History
Date
Name
Owned For
Owner Type
Purchase Details
Closed on
Jul 16, 2008
Sold by
Cross Alyssa M
Bought by
Lamb Annette F
Current Estimated Value
Purchase Details
Closed on
Jan 11, 2005
Sold by
Yerger Linda and Yerger Dwight
Bought by
Cross Alyssa M
Purchase Details
Closed on
Aug 28, 2003
Sold by
Pelrine Karen and Pinney Douglas
Bought by
Yerger Dwight and Yerger Linda
Purchase Details
Closed on
Apr 9, 2001
Sold by
Tenhoor Christopher N
Bought by
Pelrine Karen and Pinney Douglas
Purchase Details
Closed on
Jan 30, 1998
Sold by
Genovese Stephen and Gresko Dameo
Bought by
Tenhoor Christopher N
Purchase Details
Closed on
Jun 30, 1995
Sold by
Berg Jeffrey F and Paget Debra H
Bought by
Genovese Stephen and Gresko Cameo
Create a Home Valuation Report for This Property
The Home Valuation Report is an in-depth analysis detailing your home's value as well as a comparison with similar homes in the area
Home Values in the Area
Average Home Value in this Area
Purchase History
| Date | Buyer | Sale Price | Title Company |
|---|---|---|---|
| Lamb Annette F | $387,500 | -- | |
| Cross Alyssa M | $384,900 | -- | |
| Yerger Dwight | $325,000 | -- | |
| Pelrine Karen | $295,000 | -- | |
| Tenhoor Christopher N | $144,500 | -- | |
| Genovese Stephen | $121,500 | -- |
Source: Public Records
Mortgage History
| Date | Status | Borrower | Loan Amount |
|---|---|---|---|
| Open | Genovese Stephen | $204,100 | |
| Closed | Genovese Stephen | $207,000 |
Source: Public Records
Tax History Compared to Growth
Tax History
| Year | Tax Paid | Tax Assessment Tax Assessment Total Assessment is a certain percentage of the fair market value that is determined by local assessors to be the total taxable value of land and additions on the property. | Land | Improvement |
|---|---|---|---|---|
| 2025 | $6,327 | $546,400 | $0 | $546,400 |
| 2024 | $5,782 | $530,500 | $0 | $530,500 |
| 2023 | $6,331 | $589,500 | $0 | $589,500 |
| 2022 | $6,291 | $578,200 | $0 | $578,200 |
| 2021 | $6,048 | $566,800 | $0 | $566,800 |
| 2020 | $5,547 | $525,300 | $0 | $525,300 |
| 2019 | $5,224 | $495,600 | $0 | $495,600 |
| 2018 | $4,897 | $467,300 | $0 | $467,300 |
| 2017 | $4,714 | $445,100 | $0 | $445,100 |
| 2016 | $4,708 | $428,000 | $0 | $428,000 |
| 2015 | $4,914 | $405,800 | $0 | $405,800 |
| 2014 | $4,773 | $379,400 | $0 | $379,400 |
Source: Public Records
Map
Nearby Homes
- 1 Primus Ave Unit 1-12
- 59 W Cedar St Unit 6
- 76 Phillips St Unit A
- 70 Phillips St Unit 3
- 80 Revere St Unit 1
- 133 Myrtle St
- 140 Charles St Unit 2
- 101 Pinckney St
- 64 Revere St
- 12 Grove St
- 6 W Hill Place
- 120 Charles St
- 6 Strong Place
- 4 Strong Place
- 80 Pinckney St
- 27 Anderson St Unit 36
- 19 Charles River Square
- 32 W Cedar St
- 28 W Cedar St Unit 2
- 1 W Hill Place
- 80 W Cedar St Unit 5
- 80 1/2 West Cedar St Unit 80H
- 80A West Cedar St Unit 4
- 80A West Cedar St Unit 3
- 80A West Cedar St Unit 2
- 80A West Cedar St Unit 1
- 80 W Cedar St Unit 6
- 80 W Cedar St Unit 88 west cedar 7
- 80 W Cedar St Unit 7
- 80 W Cedar St Unit cedar st boston
- 80 W Cedar St
- 80 W Cedar St Unit 80A
- 80 W Cedar St Unit 4
- 80 W Cedar St Unit 1 1
- 80 W Cedar St Unit 2##
- 80 W Cedar St Unit 1/2
- 80A W Cedar St Unit 1
- 80A W Cedar St Unit 4
- 80 West Cedar St Unit 4
- 80 West Cedar St Unit 3