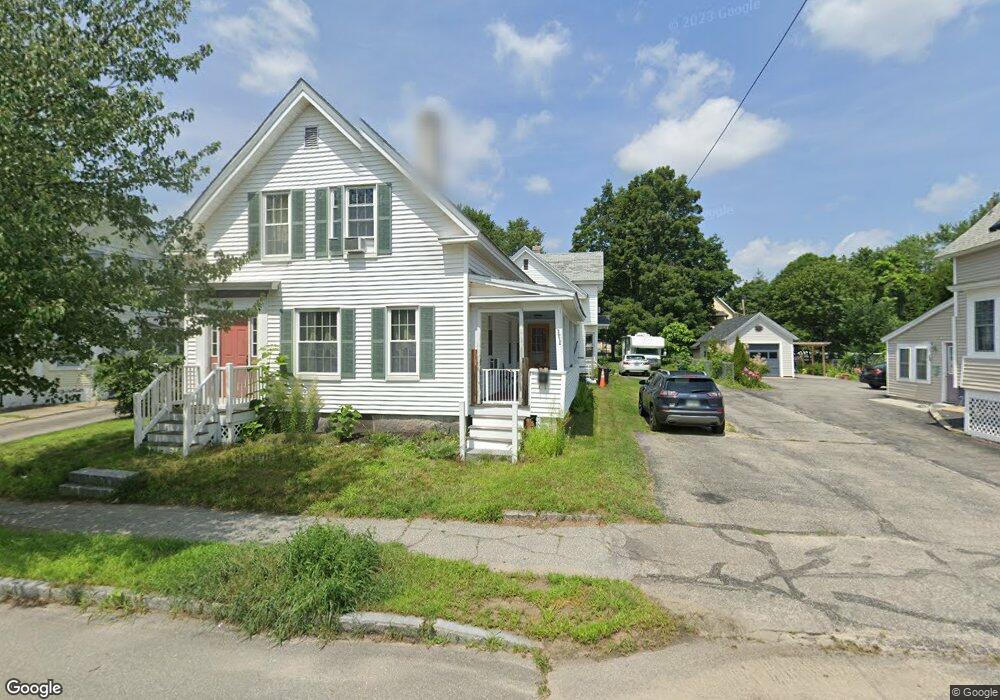
80 West St Concord, NH 03301
South End NeighborhoodEstimated Value: $399,690 - $528,000
7
Beds
2
Baths
2,400
Sq Ft
$191/Sq Ft
Est. Value
About This Home
This home is located at 80 West St, Concord, NH 03301 and is currently estimated at $458,673, approximately $191 per square foot. 80 West St is a home located in Merrimack County with nearby schools including Christa McAuliffe School, Rundlett Middle School, and Concord High School.
Ownership History
Date
Name
Owned For
Owner Type
Purchase Details
Closed on
Aug 28, 1996
Sold by
Perkins Mona G
Bought by
Crafts James M and Crafts Patricia Y
Current Estimated Value
Home Financials for this Owner
Home Financials are based on the most recent Mortgage that was taken out on this home.
Original Mortgage
$49,200
Outstanding Balance
$4,217
Interest Rate
8.18%
Mortgage Type
Purchase Money Mortgage
Estimated Equity
$454,456
Create a Home Valuation Report for This Property
The Home Valuation Report is an in-depth analysis detailing your home's value as well as a comparison with similar homes in the area
Home Values in the Area
Average Home Value in this Area
Purchase History
| Date | Buyer | Sale Price | Title Company |
|---|---|---|---|
| Crafts James M | $61,500 | -- |
Source: Public Records
Mortgage History
| Date | Status | Borrower | Loan Amount |
|---|---|---|---|
| Open | Crafts James M | $49,200 |
Source: Public Records
Tax History Compared to Growth
Tax History
| Year | Tax Paid | Tax Assessment Tax Assessment Total Assessment is a certain percentage of the fair market value that is determined by local assessors to be the total taxable value of land and additions on the property. | Land | Improvement |
|---|---|---|---|---|
| 2024 | $7,438 | $268,600 | $92,100 | $176,500 |
| 2023 | $7,215 | $268,600 | $92,100 | $176,500 |
| 2022 | $6,954 | $268,600 | $92,100 | $176,500 |
| 2021 | $6,747 | $268,600 | $92,100 | $176,500 |
| 2020 | $6,050 | $226,100 | $73,500 | $152,600 |
| 2019 | $5,592 | $201,300 | $68,300 | $133,000 |
| 2018 | $5,345 | $189,600 | $68,300 | $121,300 |
| 2017 | $5,100 | $180,600 | $68,300 | $112,300 |
| 2016 | $4,864 | $175,800 | $68,300 | $107,500 |
| 2015 | $4,415 | $161,500 | $66,900 | $94,600 |
| 2014 | $4,330 | $161,500 | $66,900 | $94,600 |
| 2013 | $3,886 | $151,900 | $66,900 | $85,000 |
| 2012 | $3,368 | $138,200 | $66,900 | $71,300 |
Source: Public Records
Map
Nearby Homes
- 0 Spruce St Unit 88
- 33 Spruce St
- 24 Badger St
- 12 Avon St
- 14 Downing St
- 122 South St
- 47 South St
- 105 S Main St
- 75 S State St
- 14-16 Perley St
- 10 Perley St
- 87 S Main St Unit 2
- 0 South St Unit 4969509
- 4 Fayette St
- 54 Pleasant St Unit 8
- 15 Wilson Ave
- 22 Wilson Ave
- 376 S Main St
- 2 Kensington Rd
- 17 Essex St
- 76 West St
- 82 West St
- 84 West St Unit 86
- 74 West St
- 84/86 West St
- 72 West St
- 63 West St
- 3 Leighton Ave
- 90 Redwood Ave
- 10 Redwood Ave
- 1 Dunklee St
- 1 Dunklee St Unit 1 Dunklee St
- 88 West St
- 95 Redwood Ave
- 57 West St Unit 2R
- 57 West St Unit 2F
- 57 West St Unit 1
- 57 West St
- 59 Downing St Unit 61
- 70 West St