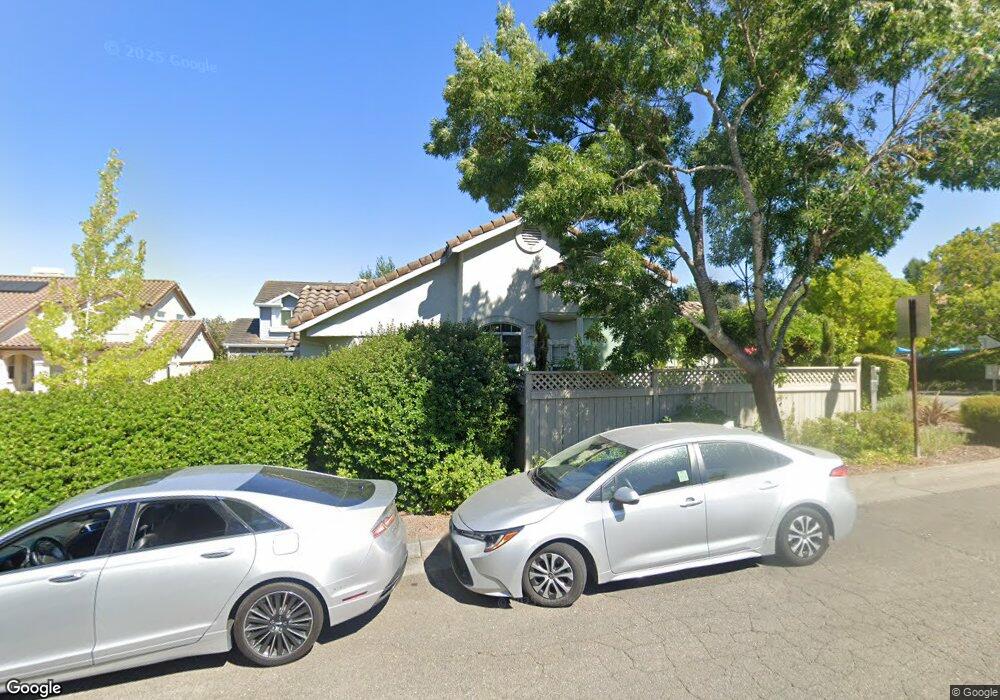
80 Windsor Ln Petaluma, CA 94952
Western Petaluma NeighborhoodEstimated Value: $1,055,000 - $1,097,000
3
Beds
2
Baths
1,533
Sq Ft
$699/Sq Ft
Est. Value
About This Home
This home is located at 80 Windsor Ln, Petaluma, CA 94952 and is currently estimated at $1,071,120, approximately $698 per square foot. 80 Windsor Ln is a home located in Sonoma County with nearby schools including McNear Elementary School, Petaluma Junior High School, and Petaluma High School.
Ownership History
Date
Name
Owned For
Owner Type
Purchase Details
Closed on
May 26, 2021
Sold by
Kay Sharon and Fisher Jeffrey John
Bought by
Kay Sharon
Current Estimated Value
Purchase Details
Closed on
Jul 14, 2016
Sold by
Wear Denise S P and Flagg Denise S P
Bought by
Kay Sharon
Home Financials for this Owner
Home Financials are based on the most recent Mortgage that was taken out on this home.
Original Mortgage
$521,250
Outstanding Balance
$416,383
Interest Rate
3.6%
Mortgage Type
New Conventional
Estimated Equity
$654,737
Purchase Details
Closed on
Jul 13, 2016
Sold by
Wear Henry Curtis
Bought by
Wear Denise S P
Home Financials for this Owner
Home Financials are based on the most recent Mortgage that was taken out on this home.
Original Mortgage
$521,250
Outstanding Balance
$416,383
Interest Rate
3.6%
Mortgage Type
New Conventional
Estimated Equity
$654,737
Create a Home Valuation Report for This Property
The Home Valuation Report is an in-depth analysis detailing your home's value as well as a comparison with similar homes in the area
Home Values in the Area
Average Home Value in this Area
Purchase History
| Date | Buyer | Sale Price | Title Company |
|---|---|---|---|
| Kay Sharon | -- | Title 365 Coraopolis | |
| Kay Sharon | $695,000 | First American Title Company | |
| Wear Denise S P | -- | First American Title Company |
Source: Public Records
Mortgage History
| Date | Status | Borrower | Loan Amount |
|---|---|---|---|
| Open | Kay Sharon | $521,250 | |
| Closed | Wear Denise S P | $103,555 |
Source: Public Records
Tax History
| Year | Tax Paid | Tax Assessment Tax Assessment Total Assessment is a certain percentage of the fair market value that is determined by local assessors to be the total taxable value of land and additions on the property. | Land | Improvement |
|---|---|---|---|---|
| 2025 | $8,632 | $806,601 | $324,961 | $481,640 |
| 2024 | $8,632 | $790,787 | $318,590 | $472,197 |
| 2023 | $8,632 | $775,283 | $312,344 | $462,939 |
| 2022 | $8,369 | $760,082 | $306,220 | $453,862 |
| 2021 | $8,210 | $745,179 | $300,216 | $444,963 |
| 2020 | $8,280 | $737,539 | $297,138 | $440,401 |
| 2019 | $8,176 | $723,078 | $291,312 | $431,766 |
| 2018 | $8,144 | $708,900 | $285,600 | $423,300 |
| 2017 | $7,987 | $695,000 | $280,000 | $415,000 |
| 2016 | $4,402 | $376,092 | $174,058 | $202,034 |
| 2015 | $4,342 | $370,444 | $171,444 | $199,000 |
| 2014 | $4,321 | $363,188 | $168,086 | $195,102 |
Source: Public Records
Map
Nearby Homes
Your Personal Tour Guide
Ask me questions while you tour the home.