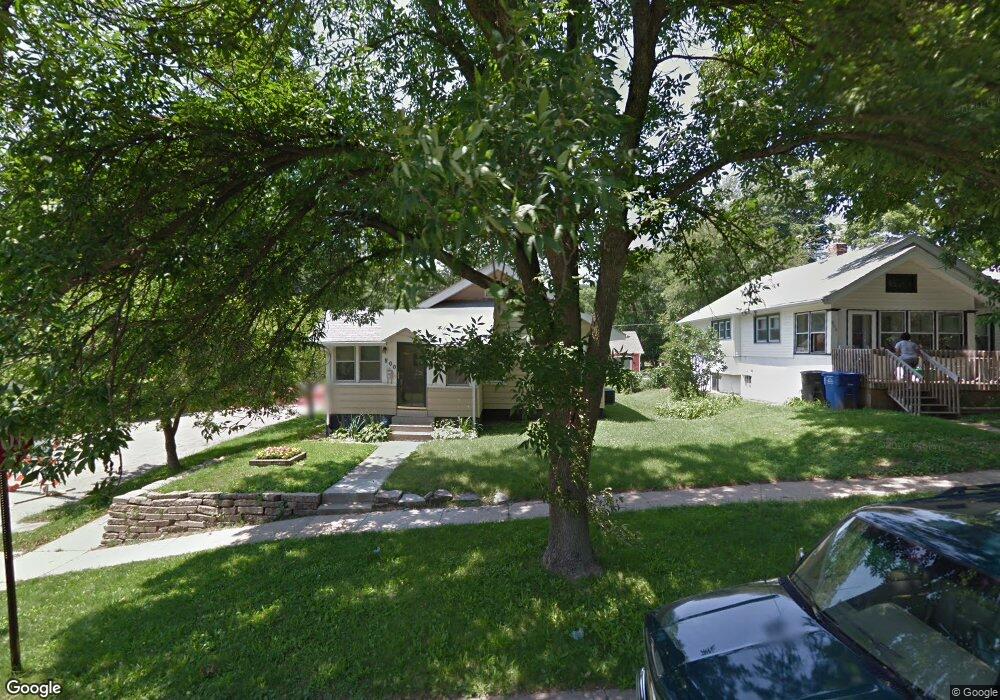
800 25th St Des Moines, IA 50312
Woodland Heights NeighborhoodEstimated Value: $134,000 - $162,238
2
Beds
1
Bath
844
Sq Ft
$181/Sq Ft
Est. Value
About This Home
This home is located at 800 25th St, Des Moines, IA 50312 and is currently estimated at $153,060, approximately $181 per square foot. 800 25th St is a home located in Polk County with nearby schools including Greenwood Elementary School, Roosevelt High School, and Bergman Academy.
Ownership History
Date
Name
Owned For
Owner Type
Purchase Details
Closed on
Jul 26, 2007
Sold by
Jones Lori Jean Jeffries and Jones Dennis Lee
Bought by
Jackson Angela J
Current Estimated Value
Home Financials for this Owner
Home Financials are based on the most recent Mortgage that was taken out on this home.
Original Mortgage
$76,500
Outstanding Balance
$48,461
Interest Rate
6.76%
Mortgage Type
Purchase Money Mortgage
Estimated Equity
$104,599
Purchase Details
Closed on
Dec 18, 2001
Sold by
Proudfit Bette Jo
Bought by
Collier Lori and Collier Lori J
Create a Home Valuation Report for This Property
The Home Valuation Report is an in-depth analysis detailing your home's value as well as a comparison with similar homes in the area
Home Values in the Area
Average Home Value in this Area
Purchase History
| Date | Buyer | Sale Price | Title Company |
|---|---|---|---|
| Jackson Angela J | $84,500 | None Available | |
| Collier Lori | $43,000 | -- |
Source: Public Records
Mortgage History
| Date | Status | Borrower | Loan Amount |
|---|---|---|---|
| Open | Jackson Angela J | $76,500 |
Source: Public Records
Tax History Compared to Growth
Tax History
| Year | Tax Paid | Tax Assessment Tax Assessment Total Assessment is a certain percentage of the fair market value that is determined by local assessors to be the total taxable value of land and additions on the property. | Land | Improvement |
|---|---|---|---|---|
| 2025 | $2,518 | $157,100 | $33,100 | $124,000 |
| 2024 | $2,518 | $138,500 | $29,200 | $109,300 |
| 2023 | $2,384 | $138,500 | $29,200 | $109,300 |
| 2022 | $2,364 | $110,000 | $23,800 | $86,200 |
| 2021 | $2,212 | $110,000 | $23,800 | $86,200 |
| 2020 | $2,292 | $97,200 | $21,200 | $76,000 |
| 2019 | $2,088 | $97,200 | $21,200 | $76,000 |
| 2018 | $2,062 | $86,200 | $18,500 | $67,700 |
| 2017 | $1,980 | $86,200 | $18,500 | $67,700 |
| 2016 | $1,924 | $81,700 | $17,500 | $64,200 |
| 2015 | $1,924 | $81,700 | $17,500 | $64,200 |
| 2014 | $1,796 | $76,300 | $16,200 | $60,100 |
Source: Public Records
Map
Nearby Homes