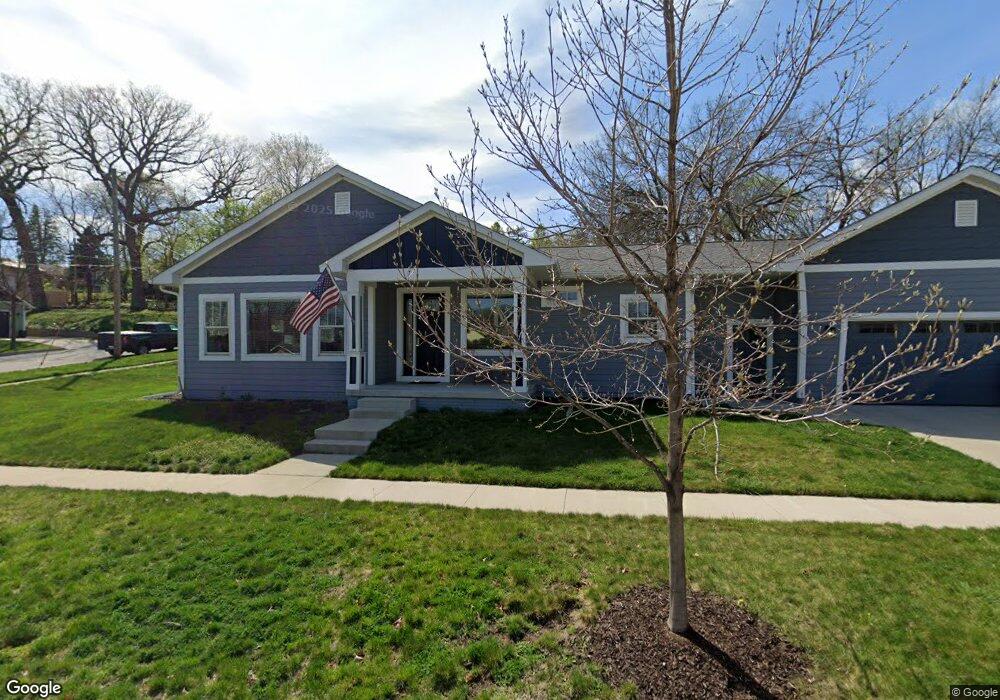
800 26th St Des Moines, IA 50312
Woodland Heights NeighborhoodEstimated Value: $300,000 - $446,000
3
Beds
3
Baths
1,442
Sq Ft
$283/Sq Ft
Est. Value
About This Home
This home is located at 800 26th St, Des Moines, IA 50312 and is currently estimated at $407,783, approximately $282 per square foot. 800 26th St is a home with nearby schools including Greenwood Elementary School and Roosevelt High School.
Ownership History
Date
Name
Owned For
Owner Type
Purchase Details
Closed on
Dec 4, 2024
Sold by
Nelson Mark G and Nelson Stephanie F
Bought by
Nelson Family Revocable Trust and Nelson
Current Estimated Value
Purchase Details
Closed on
May 2, 2016
Sold by
Rally Cap Properties Llc
Bought by
Nelson Mark G and Nelson Stephanie F
Purchase Details
Closed on
Aug 18, 2010
Sold by
Herndon William M and Herndon Lucille D
Bought by
Herndon William M and Herndon Lucille D
Create a Home Valuation Report for This Property
The Home Valuation Report is an in-depth analysis detailing your home's value as well as a comparison with similar homes in the area
Home Values in the Area
Average Home Value in this Area
Purchase History
| Date | Buyer | Sale Price | Title Company |
|---|---|---|---|
| Nelson Family Revocable Trust | -- | None Listed On Document | |
| Nelson Family Revocable Trust | -- | None Listed On Document | |
| Nelson Mark G | $28,000 | None Available | |
| Herndon William M | -- | None Available |
Source: Public Records
Tax History Compared to Growth
Tax History
| Year | Tax Paid | Tax Assessment Tax Assessment Total Assessment is a certain percentage of the fair market value that is determined by local assessors to be the total taxable value of land and additions on the property. | Land | Improvement |
|---|---|---|---|---|
| 2025 | $3,450 | $512,500 | $39,400 | $473,100 |
| 2024 | $3,450 | $175,400 | $34,700 | $140,700 |
| 2023 | $1,716 | $457,400 | $34,700 | $422,700 |
| 2022 | $1,702 | $354,800 | $28,300 | $326,500 |
| 2021 | $830 | $354,800 | $28,300 | $326,500 |
| 2020 | $830 | $314,000 | $25,200 | $288,800 |
| 2019 | $698 | $314,000 | $25,200 | $288,800 |
| 2018 | $574 | $308,000 | $22,000 | $286,000 |
| 2017 | $404 | $142,000 | $17,600 | $124,400 |
| 2016 | $392 | $14,900 | $10,900 | $4,000 |
Source: Public Records
Map
Nearby Homes