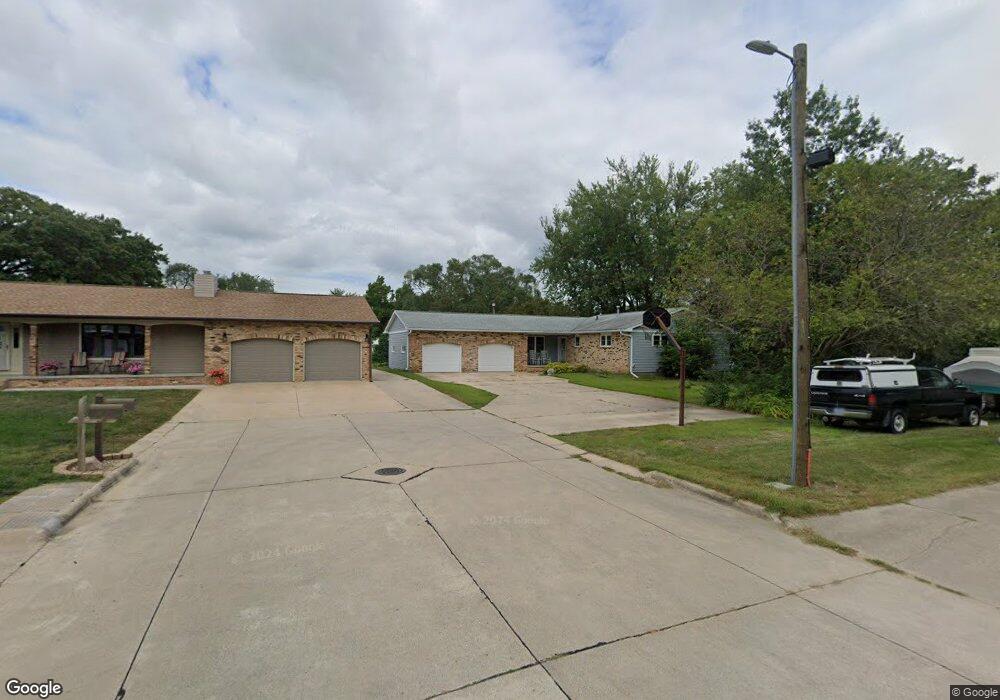
800 7th St SE Independence, IA 50644
Estimated Value: $220,000 - $285,000
3
Beds
4
Baths
1,542
Sq Ft
$167/Sq Ft
Est. Value
About This Home
This home is located at 800 7th St SE, Independence, IA 50644 and is currently estimated at $257,093, approximately $166 per square foot. 800 7th St SE is a home located in Buchanan County with nearby schools including West Elementary School, East Elementary School, and Independence Junior/Senior High School.
Ownership History
Date
Name
Owned For
Owner Type
Purchase Details
Closed on
Jun 25, 2010
Sold by
Davidson Gary L and Davidson Diane M
Bought by
Vanburen Sean J and Van Buren Sarah N
Current Estimated Value
Home Financials for this Owner
Home Financials are based on the most recent Mortgage that was taken out on this home.
Original Mortgage
$162,000
Outstanding Balance
$107,502
Interest Rate
4.77%
Mortgage Type
New Conventional
Estimated Equity
$149,591
Create a Home Valuation Report for This Property
The Home Valuation Report is an in-depth analysis detailing your home's value as well as a comparison with similar homes in the area
Home Values in the Area
Average Home Value in this Area
Purchase History
| Date | Buyer | Sale Price | Title Company |
|---|---|---|---|
| Vanburen Sean J | $180,000 | None Available |
Source: Public Records
Mortgage History
| Date | Status | Borrower | Loan Amount |
|---|---|---|---|
| Open | Vanburen Sean J | $162,000 |
Source: Public Records
Tax History Compared to Growth
Tax History
| Year | Tax Paid | Tax Assessment Tax Assessment Total Assessment is a certain percentage of the fair market value that is determined by local assessors to be the total taxable value of land and additions on the property. | Land | Improvement |
|---|---|---|---|---|
| 2025 | $4,526 | $276,850 | $38,670 | $238,180 |
| 2024 | $4,526 | $244,560 | $34,530 | $210,030 |
| 2023 | $4,384 | $244,560 | $34,530 | $210,030 |
| 2022 | $4,014 | $203,080 | $27,400 | $175,680 |
| 2021 | $4,014 | $203,080 | $27,400 | $175,680 |
| 2020 | $4,014 | $188,480 | $24,910 | $163,570 |
| 2019 | $3,948 | $188,480 | $24,910 | $163,570 |
| 2018 | $3,780 | $183,240 | $24,910 | $158,330 |
| 2017 | $3,974 | $183,240 | $24,910 | $158,330 |
| 2016 | $3,908 | $189,350 | $20,750 | $168,600 |
| 2015 | $3,908 | $189,350 | $20,750 | $168,600 |
| 2014 | $3,986 | $189,350 | $20,750 | $168,600 |
Source: Public Records
Map
Nearby Homes