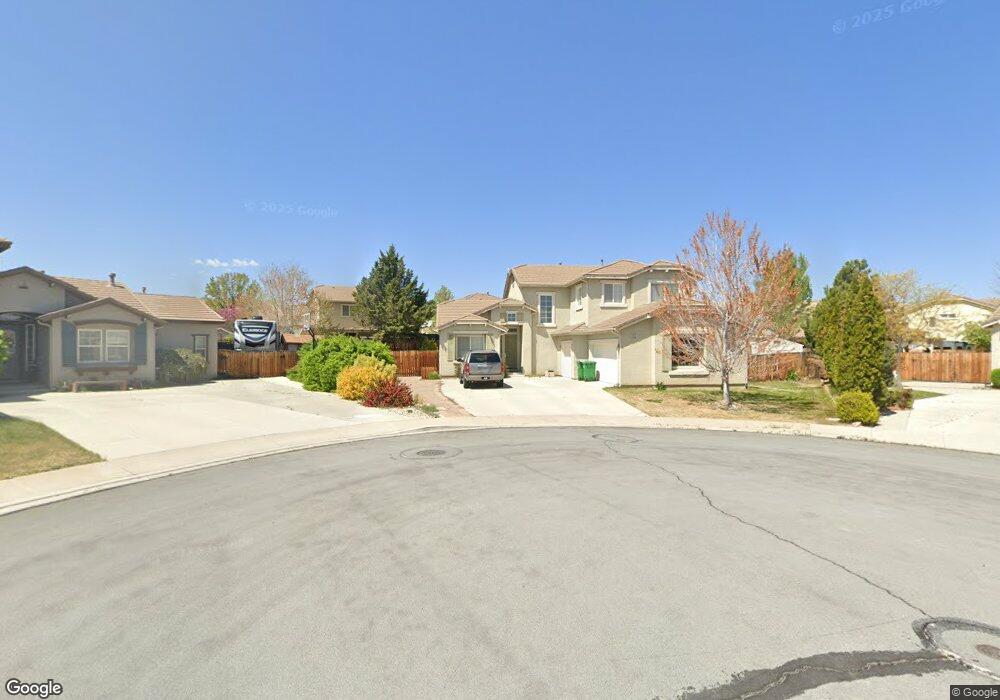
800 Baxter Pass Ct Unit 5 Sparks, NV 89436
Sparks Galleria NeighborhoodEstimated Value: $677,000 - $687,582
4
Beds
3
Baths
2,813
Sq Ft
$242/Sq Ft
Est. Value
About This Home
This home is located at 800 Baxter Pass Ct Unit 5, Sparks, NV 89436 and is currently estimated at $681,396, approximately $242 per square foot. 800 Baxter Pass Ct Unit 5 is a home located in Washoe County with nearby schools including Miguel Sepulveda Elementary School, Sky Ranch Middle School, and Edward C Reed High School.
Ownership History
Date
Name
Owned For
Owner Type
Purchase Details
Closed on
Jul 15, 2008
Sold by
Hsbc Bank Usa Na
Bought by
Dyer Thomas L and Dyer Diane L
Current Estimated Value
Home Financials for this Owner
Home Financials are based on the most recent Mortgage that was taken out on this home.
Original Mortgage
$263,303
Outstanding Balance
$172,768
Interest Rate
6.41%
Mortgage Type
FHA
Estimated Equity
$508,628
Purchase Details
Closed on
Jan 12, 2008
Sold by
Rios Edelmira Vega
Bought by
Us Bank Na and C-Bass Mortgage Loan Asset Backed Certif
Purchase Details
Closed on
Aug 6, 2004
Sold by
R & K Homes Kiley Ranch Ii Llc
Bought by
Rios Edelmira V
Home Financials for this Owner
Home Financials are based on the most recent Mortgage that was taken out on this home.
Original Mortgage
$277,924
Interest Rate
8.55%
Mortgage Type
Unknown
Create a Home Valuation Report for This Property
The Home Valuation Report is an in-depth analysis detailing your home's value as well as a comparison with similar homes in the area
Home Values in the Area
Average Home Value in this Area
Purchase History
| Date | Buyer | Sale Price | Title Company |
|---|---|---|---|
| Dyer Thomas L | $300,000 | First American Title Reno | |
| Hsbc Bank Usa Na | $300,000 | First American Title Reno | |
| Us Bank Na | $331,200 | Ticor Title Reno | |
| Rios Edelmira V | $309,000 | First American Title |
Source: Public Records
Mortgage History
| Date | Status | Borrower | Loan Amount |
|---|---|---|---|
| Open | Dyer Thomas L | $263,303 | |
| Previous Owner | Rios Edelmira V | $277,924 |
Source: Public Records
Tax History Compared to Growth
Tax History
| Year | Tax Paid | Tax Assessment Tax Assessment Total Assessment is a certain percentage of the fair market value that is determined by local assessors to be the total taxable value of land and additions on the property. | Land | Improvement |
|---|---|---|---|---|
| 2025 | $3,971 | $170,799 | $40,388 | $130,411 |
| 2024 | $3,971 | $166,534 | $35,648 | $130,886 |
| 2023 | $3,858 | $164,461 | $40,719 | $123,742 |
| 2022 | $3,744 | $133,646 | $30,613 | $103,033 |
| 2021 | $3,469 | $128,732 | $26,276 | $102,456 |
| 2020 | $3,261 | $128,417 | $25,909 | $102,508 |
| 2019 | $3,106 | $123,887 | $25,137 | $98,750 |
| 2018 | $2,964 | $115,560 | $19,184 | $96,376 |
| 2017 | $2,847 | $114,986 | $18,596 | $96,390 |
| 2016 | $2,773 | $113,800 | $16,280 | $97,520 |
| 2015 | $2,769 | $111,235 | $14,222 | $97,013 |
| 2014 | $2,684 | $97,216 | $13,377 | $83,839 |
| 2013 | -- | $71,779 | $9,886 | $61,893 |
Source: Public Records
Map
Nearby Homes
- 811 Pinchot Pass Ct Unit 5
- 801 Pinchot Pass Ct Unit 7
- 5365 Ebbetts Pass Dr
- 6835 Summit View Dr
- 6671 April St
- 601 W Equinox Peak Ct
- 601 W Equinox Peak Ct Unit Homesite 2030
- 5049 Keams Ct
- 6835 Pah Rah Dr
- 6920 Pah Rah Dr
- 4956 Monrovia Dr
- 2084 Great Bluffs Ln Unit Homesite 5132
- 2094 Great Bluffs Ln Unit Homesite 5133
- 7129 Singing Tree Rd Unit Homesite 5121
- 6550 Pyramid Way Unit 61
- 4950 San Diego Ct
- 6560 Pyramid Way Unit 52
- 5651 Hunting Creek Way
- 6690 Dorchester Dr
- 5725 Crooked Stick Way
- 810 Baxter Pass Ct Unit 5
- 5216 Vidette Meadows Dr
- 5204 Vidette Meadows Dr
- 805 Baxter Pass Ct Unit 5
- 5228 Vidette Meadows Dr Unit 5
- 5196 Vidette Meadows Dr Unit 5
- 820 Baxter Pass Ct
- 815 Baxter Pass Ct Unit 5
- 5188 Vidette Meadows Dr
- 821 Pinchot Pass Ct Unit 7
- 5252 Vidette Meadows Dr Unit 5
- 5215 Vidette Meadows Dr Unit 5
- 5203 Vidette Meadows Dr Unit 5
- 5146 Vidette Meadows Dr
- 5178 Vidette Meadows Dr Unit 5
- 5138 Vidette Meadows Dr Unit 7
- 800 Pinchot Pass Ct Unit 5
- 5195 Vidette Meadows Dr
- 5239 Vidette Meadows Dr Unit 5
- 5264 Vidette Meadows Dr