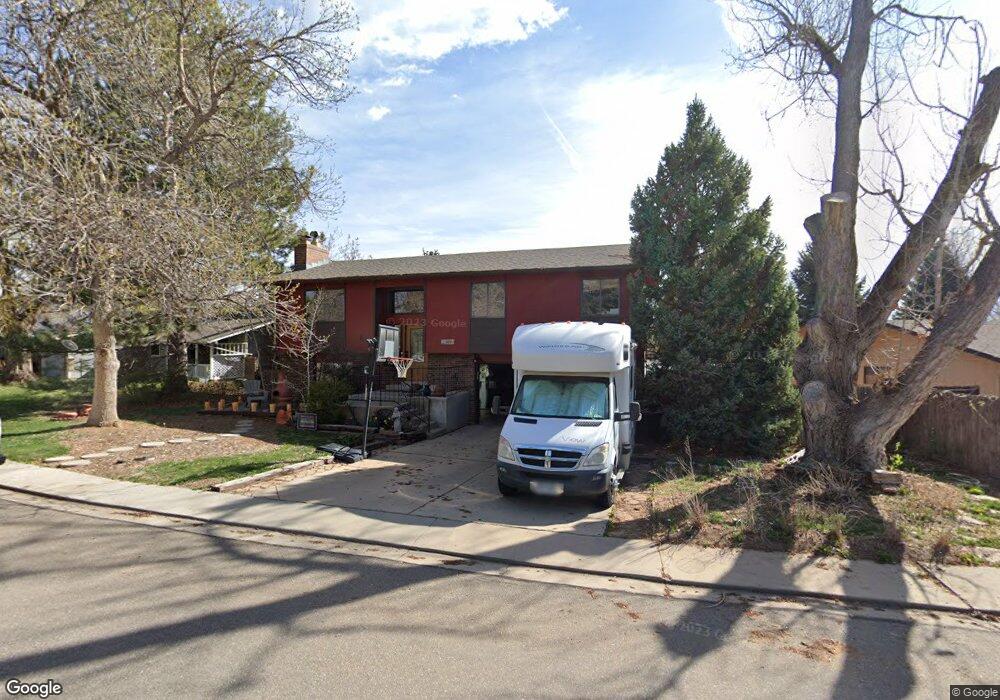
800 Delphi Dr Lafayette, CO 80026
Estimated Value: $610,279 - $700,000
3
Beds
2
Baths
1,176
Sq Ft
$553/Sq Ft
Est. Value
About This Home
This home is located at 800 Delphi Dr, Lafayette, CO 80026 and is currently estimated at $650,070, approximately $552 per square foot. 800 Delphi Dr is a home located in Boulder County with nearby schools including Lafayette Elementary School, Angevine Middle School, and Centaurus High School.
Ownership History
Date
Name
Owned For
Owner Type
Purchase Details
Closed on
May 22, 1996
Sold by
Craig Damon E and Craig Rena L
Bought by
Dawson Roy E
Current Estimated Value
Home Financials for this Owner
Home Financials are based on the most recent Mortgage that was taken out on this home.
Original Mortgage
$136,200
Outstanding Balance
$7,803
Interest Rate
8.06%
Mortgage Type
FHA
Estimated Equity
$642,267
Purchase Details
Closed on
Aug 31, 1994
Sold by
Dalgarn Collin W and Dalgarn Denise
Bought by
Craig Damon E
Home Financials for this Owner
Home Financials are based on the most recent Mortgage that was taken out on this home.
Original Mortgage
$124,450
Interest Rate
8.46%
Purchase Details
Closed on
Jun 26, 1979
Bought by
Dawson Roy E
Purchase Details
Closed on
Jan 30, 1979
Bought by
Dawson Roy E
Create a Home Valuation Report for This Property
The Home Valuation Report is an in-depth analysis detailing your home's value as well as a comparison with similar homes in the area
Home Values in the Area
Average Home Value in this Area
Purchase History
| Date | Buyer | Sale Price | Title Company |
|---|---|---|---|
| Dawson Roy E | $138,500 | First American Heritage Titl | |
| Craig Damon E | $131,000 | Commonwealth Land Title Ins | |
| Dawson Roy E | $58,500 | -- | |
| Dawson Roy E | $142,000 | -- |
Source: Public Records
Mortgage History
| Date | Status | Borrower | Loan Amount |
|---|---|---|---|
| Open | Dawson Roy E | $136,200 | |
| Previous Owner | Craig Damon E | $124,450 |
Source: Public Records
Tax History
| Year | Tax Paid | Tax Assessment Tax Assessment Total Assessment is a certain percentage of the fair market value that is determined by local assessors to be the total taxable value of land and additions on the property. | Land | Improvement |
|---|---|---|---|---|
| 2025 | $2,669 | $36,162 | $18,056 | $18,106 |
| 2024 | $2,669 | $36,162 | $18,056 | $18,106 |
| 2023 | $2,624 | $36,823 | $18,057 | $22,452 |
| 2022 | $2,137 | $29,698 | $14,095 | $15,603 |
| 2021 | $2,113 | $30,552 | $14,500 | $16,052 |
| 2020 | $1,997 | $29,001 | $11,655 | $17,346 |
| 2019 | $1,969 | $29,001 | $11,655 | $17,346 |
| 2018 | $1,663 | $25,416 | $11,088 | $14,328 |
| 2017 | $1,619 | $28,098 | $12,258 | $15,840 |
| 2016 | $1,322 | $22,360 | $8,995 | $13,365 |
| 2015 | $1,239 | $19,112 | $5,015 | $14,097 |
| 2014 | $964 | $19,112 | $5,015 | $14,097 |
Source: Public Records
Map
Nearby Homes
- 736 Julian Cir
- 718 Julian Cir
- 1140 Nottingham St
- 365 Vernier Ave
- 920 Milo Cir Unit A
- 924 Milo Cir Unit A
- 421 S Dover Ave
- 1140 Devonshire Ct
- 1287 Doric Dr
- 372 S Carr Ave
- 1091 Milo Cir Unit B
- 1045 Milo Cir Unit A
- 1048 Milo Cir Unit A
- 1198 Milo Cir Unit A
- 1053 Delta Dr Unit B
- 1031 Delta Dr
- 167 Salina St
- 1080 Artemis Cir
- 1418 Marigold Dr
- 1115 Bacchus Dr Unit E
Your Personal Tour Guide
Ask me questions while you tour the home.