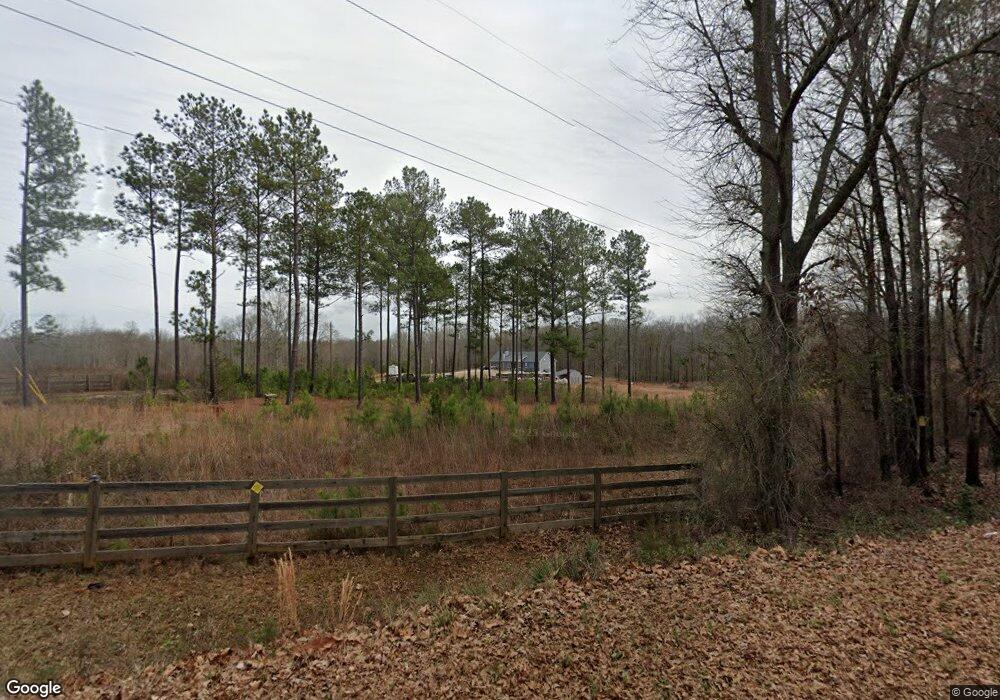
800 Dutchman Rd Griffin, GA 30223
Spalding County NeighborhoodEstimated Value: $261,000 - $562,914
--
Bed
--
Bath
1,716
Sq Ft
$209/Sq Ft
Est. Value
About This Home
This home is located at 800 Dutchman Rd, Griffin, GA 30223 and is currently estimated at $358,479, approximately $208 per square foot. 800 Dutchman Rd is a home with nearby schools including Jackson Road Elementary School, Kennedy Road Middle School, and Spalding High School.
Ownership History
Date
Name
Owned For
Owner Type
Purchase Details
Closed on
Aug 16, 2019
Sold by
Georgia Properties Inc
Bought by
Adkins Stephen D and Adkins Lydia V
Current Estimated Value
Purchase Details
Closed on
Jul 12, 2019
Sold by
Georgia Properties Inc
Bought by
Nash Kason A
Purchase Details
Closed on
Jul 9, 2019
Sold by
Georgia Properties Inc
Bought by
Dowdy Seth G
Purchase Details
Closed on
May 15, 2019
Sold by
Georgia Properties Inc
Bought by
Hall Constance A
Purchase Details
Closed on
Apr 24, 2019
Sold by
Georgia Properties Inc
Bought by
Brewer Ryan C
Purchase Details
Closed on
Apr 23, 2019
Sold by
Georgia Properties Inc
Bought by
Simpson Jennifer L and Welchel Debra N
Purchase Details
Closed on
Apr 11, 2019
Sold by
Georgia Properties Inc
Bought by
Thomas Thomas Stephen Stephen
Purchase Details
Closed on
Apr 9, 2019
Sold by
Georgia Properties Inc
Bought by
Reid D Michael
Purchase Details
Closed on
Apr 5, 2019
Sold by
Georgia Properties Inc
Bought by
Marin Gerardo
Purchase Details
Closed on
Mar 26, 2019
Sold by
Georgia Properties Inc
Bought by
Ritter Severin and Ritter Vickie
Purchase Details
Closed on
Mar 4, 2019
Sold by
Georgia Properties Inc
Bought by
Hellinger Jaret
Purchase Details
Closed on
Feb 28, 2019
Sold by
Georgia Properties Inc
Bought by
Toumbleston Stacy A and Toumbleston Dariene E
Purchase Details
Closed on
Feb 15, 2019
Sold by
Georgia Properties Inc
Bought by
Osorio Jose A
Purchase Details
Closed on
Feb 12, 2019
Sold by
Georgia Properties Inc
Bought by
Cable Frank G
Purchase Details
Closed on
Jan 31, 2019
Sold by
Georgia Properties Inc
Bought by
Fasci Adriel A and Fasci Sherri L
Purchase Details
Closed on
Jan 28, 2019
Sold by
Georgia Properties Inc
Bought by
Nelms Charles S and Nelms Tonya B
Purchase Details
Closed on
Jan 25, 2019
Sold by
Georgia Properties Inc
Bought by
Parker Savanna L
Purchase Details
Closed on
Jan 24, 2019
Sold by
Oxford William M
Bought by
Georgia Properties Inc
Purchase Details
Closed on
Oct 15, 2015
Sold by
Oxford Michael
Bought by
Dorton Byron Scott and Dorton Christine
Purchase Details
Closed on
Dec 23, 1982
Sold by
Oxford Guy and Oxford Mildred
Bought by
Oxford Michael Dr and Oxford Elsey M
Purchase Details
Closed on
Sep 8, 1979
Sold by
Oxford Guy
Bought by
Oxford Guy and Oxford Mildred
Purchase Details
Closed on
May 11, 1971
Sold by
Oxford Oxford T and Oxford Guy
Bought by
Oxford Guy and Oxford Myra F
Purchase Details
Closed on
Mar 6, 1958
Bought by
Oxford Oxford T and Oxford Guy
Create a Home Valuation Report for This Property
The Home Valuation Report is an in-depth analysis detailing your home's value as well as a comparison with similar homes in the area
Home Values in the Area
Average Home Value in this Area
Purchase History
| Date | Buyer | Sale Price | Title Company |
|---|---|---|---|
| Adkins Stephen D | $140,000 | -- | |
| Nash Kason A | $75,000 | -- | |
| Dowdy Seth G | $45,000 | -- | |
| Hall Constance A | $57,000 | -- | |
| Brewer Ryan C | $49,000 | -- | |
| Simpson Jennifer L | $69,000 | -- | |
| Thomas Thomas Stephen Stephen | $56,000 | -- | |
| Reid D Michael | $55,000 | -- | |
| Marin Gerardo | $84,000 | -- | |
| Davis Michael E | $51,450 | -- | |
| Ritter Severin | $43,000 | -- | |
| Hellinger Jaret | $49,000 | -- | |
| Toumbleston Stacy A | $50,000 | -- | |
| Hellinger George E | $96,000 | -- | |
| Osorio Jose A | $45,500 | -- | |
| Cable Frank G | $50,000 | -- | |
| Fasci Adriel A | $34,000 | -- | |
| Nelms Charles S | $56,000 | -- | |
| Parker Savanna L | $90,000 | -- | |
| Cable Christopher F | $52,000 | -- | |
| Nash Kason A | $99,000 | -- | |
| Davis Michael E | $51,450 | -- | |
| Georgia Properties Inc | $714,081 | -- | |
| Dorton Byron Scott | $9,000 | -- | |
| Oxford Michael Dr | -- | -- | |
| Oxford Guy | -- | -- | |
| Oxford Guy | -- | -- | |
| Oxford Oxford T | -- | -- |
Source: Public Records
Tax History Compared to Growth
Tax History
| Year | Tax Paid | Tax Assessment Tax Assessment Total Assessment is a certain percentage of the fair market value that is determined by local assessors to be the total taxable value of land and additions on the property. | Land | Improvement |
|---|---|---|---|---|
| 2024 | $3,374 | $137,080 | $51,200 | $85,880 |
| 2023 | $3,374 | $51,200 | $51,200 | $0 |
| 2022 | $290 | $48,762 | $48,762 | $0 |
| 2021 | $282 | $65,125 | $65,125 | $0 |
| 2020 | $275 | $65,125 | $65,125 | $0 |
| 2019 | $8,898 | $239,058 | $239,058 | $0 |
| 2018 | $1,939 | $239,058 | $239,058 | $0 |
| 2017 | $1,834 | $239,058 | $239,058 | $0 |
| 2016 | $1,813 | $239,058 | $239,058 | $0 |
| 2015 | $1,814 | $240,953 | $240,953 | $0 |
| 2014 | $1,145 | $266,428 | $266,428 | $0 |
Source: Public Records
Map
Nearby Homes
- 1015 N Walkers Mill Rd
- 273 Dutchman Rd
- 1015 Dutchman Rd
- 860 N Walkers Mill Rd
- 1147 N Mcdonough Rd
- 0 Chehaw Rd Unit 10594275
- 0 Chehaw Rd Unit 10594272
- 140 Morris Mill Rd
- 501 Musgrove Rd
- 2650 Jackson Rd
- 4480 Jackson Rd
- 414 Allison Dr
- 2775 Jackson Rd
- 0 N Mcdonough Rd Unit 10599249
- 265 Hamil Rd Unit LOT 9
- 243 Hamil Rd Unit 13.18 AC
- 221 Hamil Rd Unit 12.5 AC
- 243 Hamil Rd
- 3128 High Falls Rd
- 230 Sapelo Rd
- 758 Dutchman Rd
- 823 N Walkers Mill Rd
- 756 Dutchman Rd
- 821 Dutchman Rd
- 738 Dutchman Rd
- 845 N Walkers Mill Rd
- 675 N Walkers Mill Rd
- 171 Hamil Rd Unit LOT 15
- 185 Hamil Rd Unit LOT 14
- 729 N Walkers Mill Rd
- 700 Dutchman Rd
- 761 Dutchman Rd
- 899 N Walkers Mill Rd
- 711 Dutchman Rd
- 300 Spring Valley Rd
- 300 Spring Valley Rd
- 851 N Walkers Mill Rd
- 831 N Walkers Mill Rd
- 968 Dutchman Rd
- 815 Dutchman Rd