Estimated Value: $269,830 - $321,000
3
Beds
2
Baths
1,240
Sq Ft
$233/Sq Ft
Est. Value
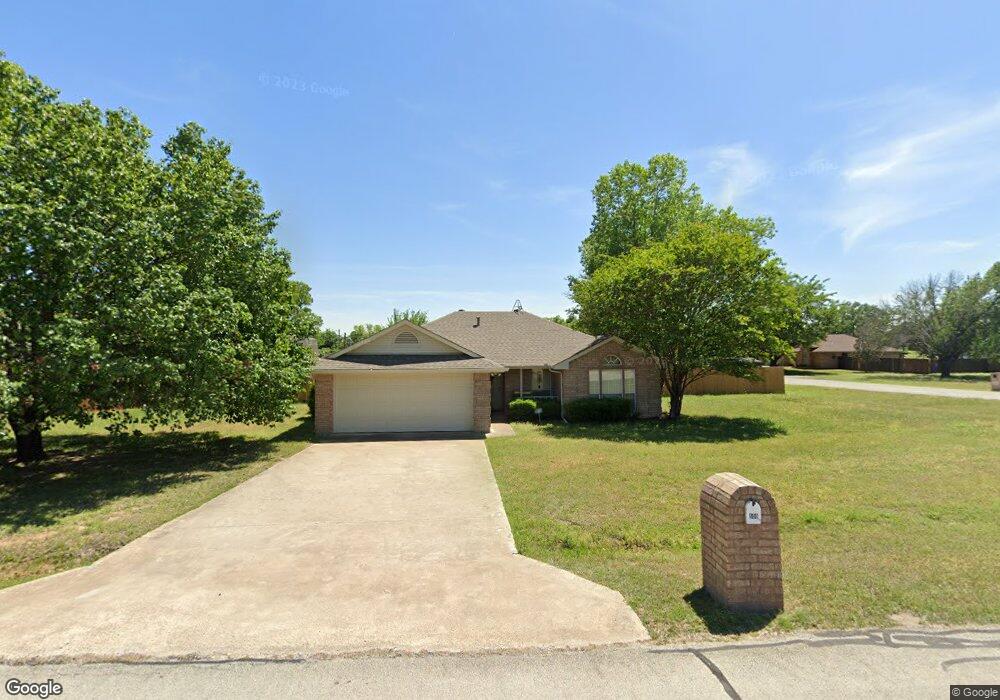
About This Home
This home is located at 800 Emily Trail, Azle, TX 76020 and is currently estimated at $289,208, approximately $233 per square foot. 800 Emily Trail is a home located in Tarrant County with nearby schools including Liberty Elementary School, W E Hoover Elementary School, and Santo Forte Junior High School.
Ownership History
Date
Name
Owned For
Owner Type
Purchase Details
Closed on
Jan 17, 2020
Sold by
Ford Billy Graham
Bought by
Browne Tara Marie and Ford Robert Graham
Current Estimated Value
Purchase Details
Closed on
Jan 15, 2002
Sold by
Browne Trevor and Browne Tara Mari
Bought by
Ford Billy G
Home Financials for this Owner
Home Financials are based on the most recent Mortgage that was taken out on this home.
Original Mortgage
$82,650
Outstanding Balance
$33,847
Interest Rate
7.07%
Estimated Equity
$255,361
Purchase Details
Closed on
Jul 18, 1996
Sold by
Wudco Properties
Bought by
Browne Trevor and Ford Tara Mari
Home Financials for this Owner
Home Financials are based on the most recent Mortgage that was taken out on this home.
Original Mortgage
$70,650
Interest Rate
8.41%
Create a Home Valuation Report for This Property
The Home Valuation Report is an in-depth analysis detailing your home's value as well as a comparison with similar homes in the area
Home Values in the Area
Average Home Value in this Area
Purchase History
| Date | Buyer | Sale Price | Title Company |
|---|---|---|---|
| Browne Tara Marie | -- | None Available | |
| Ford Billy G | -- | -- | |
| Browne Trevor | -- | Fidelity National Title Agen |
Source: Public Records
Mortgage History
| Date | Status | Borrower | Loan Amount |
|---|---|---|---|
| Open | Ford Billy G | $82,650 | |
| Previous Owner | Browne Trevor | $70,650 |
Source: Public Records
Tax History Compared to Growth
Tax History
| Year | Tax Paid | Tax Assessment Tax Assessment Total Assessment is a certain percentage of the fair market value that is determined by local assessors to be the total taxable value of land and additions on the property. | Land | Improvement |
|---|---|---|---|---|
| 2025 | $689 | $265,725 | $68,325 | $197,400 |
| 2024 | $689 | $265,725 | $68,325 | $197,400 |
| 2023 | $3,679 | $257,139 | $68,325 | $188,814 |
| 2022 | $3,900 | $212,706 | $31,885 | $180,821 |
| 2021 | $3,640 | $192,896 | $31,885 | $161,011 |
| 2020 | $3,309 | $169,981 | $15,942 | $154,039 |
| 2019 | $3,219 | $171,106 | $15,942 | $155,164 |
| 2018 | $1,354 | $144,490 | $15,942 | $128,548 |
| 2017 | $2,534 | $131,355 | $15,942 | $115,413 |
| 2016 | $2,417 | $127,168 | $15,942 | $111,226 |
| 2015 | $1,375 | $113,900 | $15,000 | $98,900 |
| 2014 | $1,375 | $113,900 | $15,000 | $98,900 |
Source: Public Records
Map
Nearby Homes
- 809 Amon Trail
- 2001 Wood Trail
- 841 Amon Trail
- 928 Herby Del Trail
- 917 Wood Trail
- 9409 Mountain Pass Dr
- 12020 Younger Ct
- 7425 Hickey Rd
- 11972 Younger Ct
- 11770 North Ct
- 101 Gordon Dr
- 7329 Hickey Rd
- 11870 Fm 730 N
- Justin Plan at Sandy Beach
- Texas Cali Plan at Sandy Beach
- Bellvue Plan at Sandy Beach
- Huntsville Plan at Sandy Beach
- Kingston Plan at Sandy Beach
- Elgin Plan at Sandy Beach
- Lakeway Plan at Sandy Beach
- 808 Emily Trail
- 2008 Wood Trail
- 1004 Katie Ct
- 801 Emily Trail
- 812 Emily Trail
- 2009 Wood Trail
- 2017 Wood Trail
- 2004 Wood Trail
- 805 Emily Trail
- 809 Emily Trail
- 813 Emily Trail
- 2021 Wood Trail
- 816 Emily Trail
- 2024 Wood Trail
- 2005 Wood Trail
- 817 Emily Trail
- 2000 Wood Trail
- 812 Amon Trail
- 808 Amon Trail
- 2025 Wood Trail