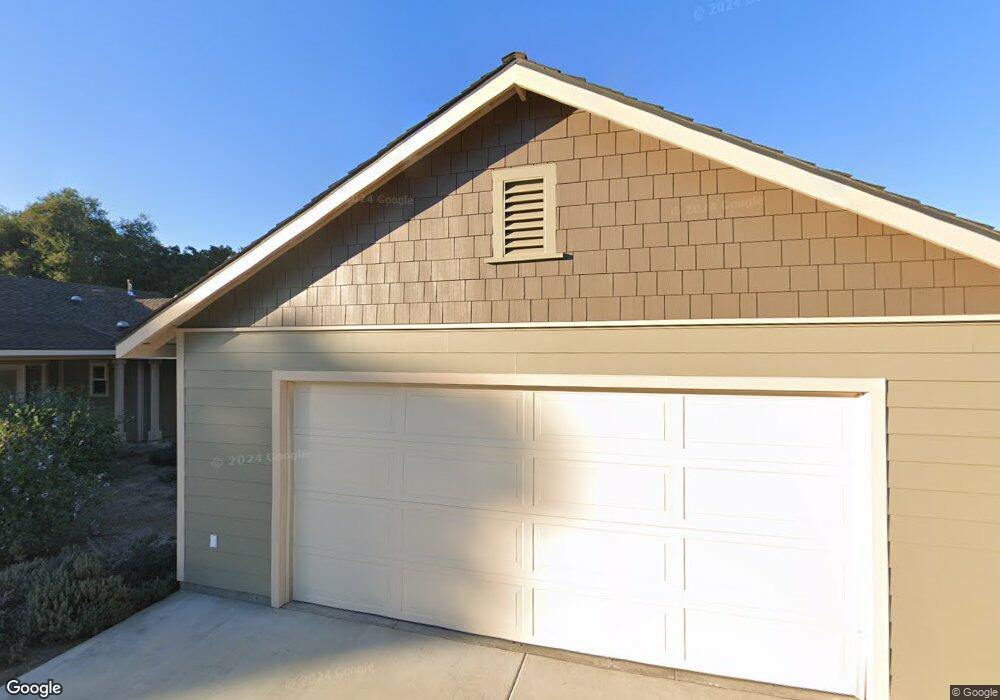
800 N Oakway Ave San Dimas, CA 91773
Estimated Value: $832,000 - $1,315,000
3
Beds
1
Bath
844
Sq Ft
$1,181/Sq Ft
Est. Value
About This Home
This home is located at 800 N Oakway Ave, San Dimas, CA 91773 and is currently estimated at $996,519, approximately $1,180 per square foot. 800 N Oakway Ave is a home located in Los Angeles County with nearby schools including Arma J. Shull Elementary School, Lone Hill Middle School, and San Dimas High School.
Ownership History
Date
Name
Owned For
Owner Type
Purchase Details
Closed on
Jun 25, 2009
Sold by
Bank Of New York
Bought by
Mounts Scott George
Current Estimated Value
Purchase Details
Closed on
Aug 29, 2008
Sold by
Burditte Jessie
Bought by
Bank Of New York and Cwabs 2005-01 Inc
Purchase Details
Closed on
Nov 17, 2005
Sold by
Gillett Christina
Bought by
Gillett Don
Purchase Details
Closed on
Sep 6, 2005
Sold by
Burditte Jessie
Bought by
Gillett Don
Purchase Details
Closed on
Nov 5, 2003
Sold by
Baca Michael Anthony and Baca Ann P
Bought by
Burditte Jessie
Home Financials for this Owner
Home Financials are based on the most recent Mortgage that was taken out on this home.
Original Mortgage
$305,900
Interest Rate
5.85%
Mortgage Type
Purchase Money Mortgage
Purchase Details
Closed on
May 5, 1994
Sold by
Baca Michael Anthony and Baca Ann P
Bought by
Baca Michael Anthony
Create a Home Valuation Report for This Property
The Home Valuation Report is an in-depth analysis detailing your home's value as well as a comparison with similar homes in the area
Home Values in the Area
Average Home Value in this Area
Purchase History
| Date | Buyer | Sale Price | Title Company |
|---|---|---|---|
| Mounts Scott George | $416,000 | Landsafe Title | |
| Bank Of New York | $324,000 | Landsafe Title | |
| Gillett Don | -- | Investors Title Company | |
| Gillett Don | -- | Investors Title Company | |
| Burditte Jessie | $441,500 | Southland Title Corporation | |
| Baca Michael Anthony | -- | -- |
Source: Public Records
Mortgage History
| Date | Status | Borrower | Loan Amount |
|---|---|---|---|
| Previous Owner | Burditte Jessie | $305,900 |
Source: Public Records
Tax History Compared to Growth
Tax History
| Year | Tax Paid | Tax Assessment Tax Assessment Total Assessment is a certain percentage of the fair market value that is determined by local assessors to be the total taxable value of land and additions on the property. | Land | Improvement |
|---|---|---|---|---|
| 2025 | $6,428 | $536,968 | $516,324 | $20,644 |
| 2024 | $6,428 | $526,440 | $506,200 | $20,240 |
| 2023 | $6,286 | $516,119 | $496,275 | $19,844 |
| 2022 | $6,185 | $506,000 | $486,545 | $19,455 |
| 2021 | $6,072 | $496,079 | $477,005 | $19,074 |
| 2019 | $5,957 | $481,366 | $462,857 | $18,509 |
| 2018 | $5,608 | $471,929 | $453,782 | $18,147 |
| 2016 | $5,412 | $453,606 | $436,162 | $17,444 |
| 2015 | $5,326 | $446,793 | $429,611 | $17,182 |
| 2014 | $5,295 | $438,042 | $421,196 | $16,846 |
Source: Public Records
Map
Nearby Homes
- 649 W Gladstone St
- 666 Pearlanna Dr
- 100 Rawlinsdale Ln
- 409 W 4th St
- 0 Dallas Rd Unit WS25141209
- 2556 Charford St
- 911 Groveton Ave
- 1302 Sierra View Dr
- 1255 Bonnie Glen Ln
- 230 W 2nd St
- 141 W 1st St
- 1287 Whisperglen Ln
- 846 Glengrove Ave
- 830 Tressy Ave
- 1150 W Juanita Ave
- 208 E 3rd St
- 1138 Las Colinas Way
- 833 N Oceanbluff Ave
- 2022 E Route 66
- 135 W Nubia St
- 812 N Oakway Ave
- 740 N Oakway Ave
- 816 N Oakway Ave
- 730 N Oakway Ave
- 720 N Oakway Ave
- 824 N Oakway Ave
- 722 N Oakway Ave
- 828 N Oakway Ave
- 729 N Oakway Ave
- 814 N Oakway Ave
- 811 N Oakway Ave
- 744 N Oakway Ave
- 744 N Oakway Ave
- 830 N Oakway Ave
- 607 W Ghent St
- 821 N Oakway Ave
- 829 N Oakway Ave
- 615 W Ghent St
- 482 Cody Rd
- 522 W Allen Ave