Estimated Value: $353,900 - $373,000
4
Beds
2
Baths
1,571
Sq Ft
$230/Sq Ft
Est. Value
About This Home
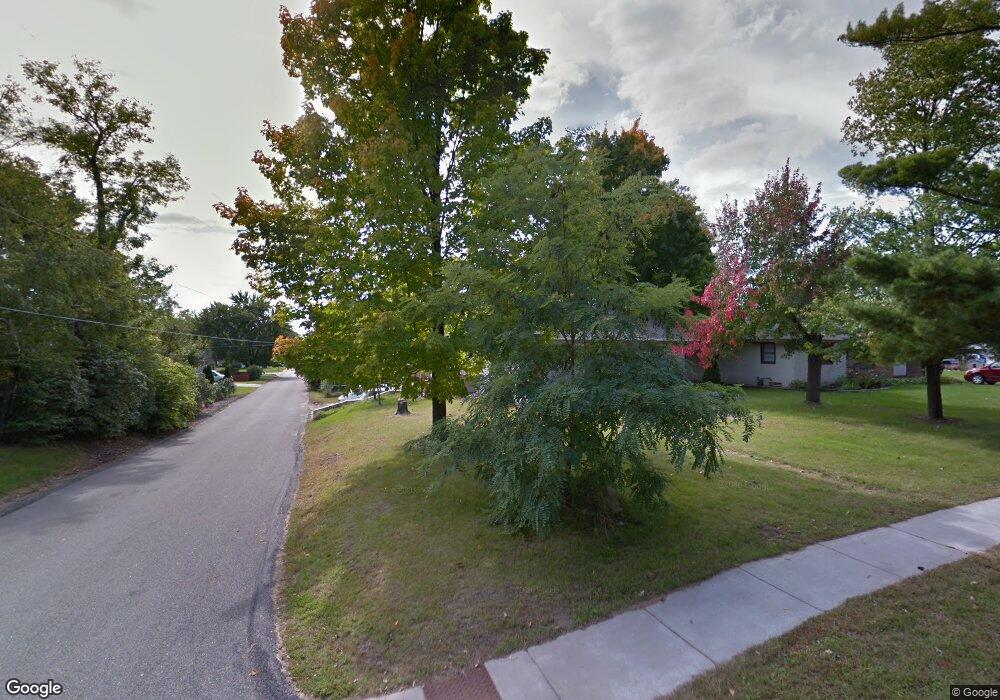
This home is located at 800 Park St, Anoka, MN 55303 and is currently estimated at $361,225, approximately $229 per square foot. 800 Park St is a home located in Anoka County with nearby schools including Franklin Elementary School, Anoka Middle School for the Arts - Fred Moor Campus, and Anoka Senior High School.
Ownership History
Date
Name
Owned For
Owner Type
Purchase Details
Closed on
Mar 2, 2021
Sold by
Wby Properties Llc
Bought by
Feathers Julie May Two
Current Estimated Value
Home Financials for this Owner
Home Financials are based on the most recent Mortgage that was taken out on this home.
Original Mortgage
$286,711
Outstanding Balance
$257,147
Interest Rate
2.73%
Mortgage Type
FHA
Estimated Equity
$104,078
Purchase Details
Closed on
Mar 8, 2020
Sold by
Wba Properties Llc
Bought by
Wby Properties Llc
Home Financials for this Owner
Home Financials are based on the most recent Mortgage that was taken out on this home.
Original Mortgage
$163,000
Interest Rate
3.4%
Mortgage Type
Commercial
Purchase Details
Closed on
Dec 13, 2013
Sold by
Yurch Robb
Bought by
Cnr Financial Llc
Purchase Details
Closed on
Nov 3, 2010
Sold by
Deutsch Bank National Trust Co
Bought by
Plasch David
Purchase Details
Closed on
Sep 27, 1996
Sold by
Scofield Randy D and Scofield Cindy L
Bought by
Nash Michael D and Nash Dannine K
Create a Home Valuation Report for This Property
The Home Valuation Report is an in-depth analysis detailing your home's value as well as a comparison with similar homes in the area
Home Values in the Area
Average Home Value in this Area
Purchase History
| Date | Buyer | Sale Price | Title Company |
|---|---|---|---|
| Feathers Julie May Two | $292,000 | Watermark Title Agency | |
| Wby Properties Llc | -- | Edina Realty Title Inc | |
| Cnr Financial Llc | -- | None Available | |
| Yurch Robb | $80,000 | None Available | |
| Plasch David | $60,000 | -- | |
| Nash Michael D | $91,500 | -- | |
| Two Feathers Julie Julie | $292,000 | -- |
Source: Public Records
Mortgage History
| Date | Status | Borrower | Loan Amount |
|---|---|---|---|
| Open | Feathers Julie May Two | $286,711 | |
| Previous Owner | Wby Properties Llc | $163,000 | |
| Closed | Two Feathers Julie Julie | $286,711 |
Source: Public Records
Tax History Compared to Growth
Tax History
| Year | Tax Paid | Tax Assessment Tax Assessment Total Assessment is a certain percentage of the fair market value that is determined by local assessors to be the total taxable value of land and additions on the property. | Land | Improvement |
|---|---|---|---|---|
| 2025 | $10,139 | $327,600 | $75,000 | $252,600 |
| 2024 | $10,139 | $322,800 | $75,000 | $247,800 |
| 2023 | $2,501 | $311,200 | $75,000 | $236,200 |
| 2022 | $2,230 | $274,300 | $58,000 | $216,300 |
| 2021 | $2,405 | $220,000 | $51,700 | $168,300 |
| 2020 | $2,547 | $216,900 | $58,000 | $158,900 |
| 2019 | $2,245 | $198,500 | $50,000 | $148,500 |
| 2018 | $2,184 | $188,300 | $0 | $0 |
| 2017 | $1,960 | $176,100 | $0 | $0 |
| 2016 | $1,999 | $152,900 | $0 | $0 |
| 2015 | -- | $152,900 | $52,000 | $100,900 |
| 2014 | -- | $124,700 | $37,000 | $87,700 |
Source: Public Records
Map
Nearby Homes
- 525 Western St
- 1032 Fremont St
- 504 Douglas St
- 706 Benton St
- 1102 Benton St
- 2642 Yellowstone Blvd
- 535 W River Pkwy
- 2750 Euclid Ave
- 2126 Branch Ave
- 13480 Wellington Ct
- 13217 Union Terrace Ln N
- 13217 Valley Forge Ln N
- 13348 Linwood Forest Cir
- 1722 River Pointe Place Unit 702
- 3035 Cutters Grove Ave
- 3104 Zuni St NW
- 3102 Zuni Way NW
- 1800 2nd Ave
- 13451 Yorktown Ln N
- 11134 Balsam Pointe Trail