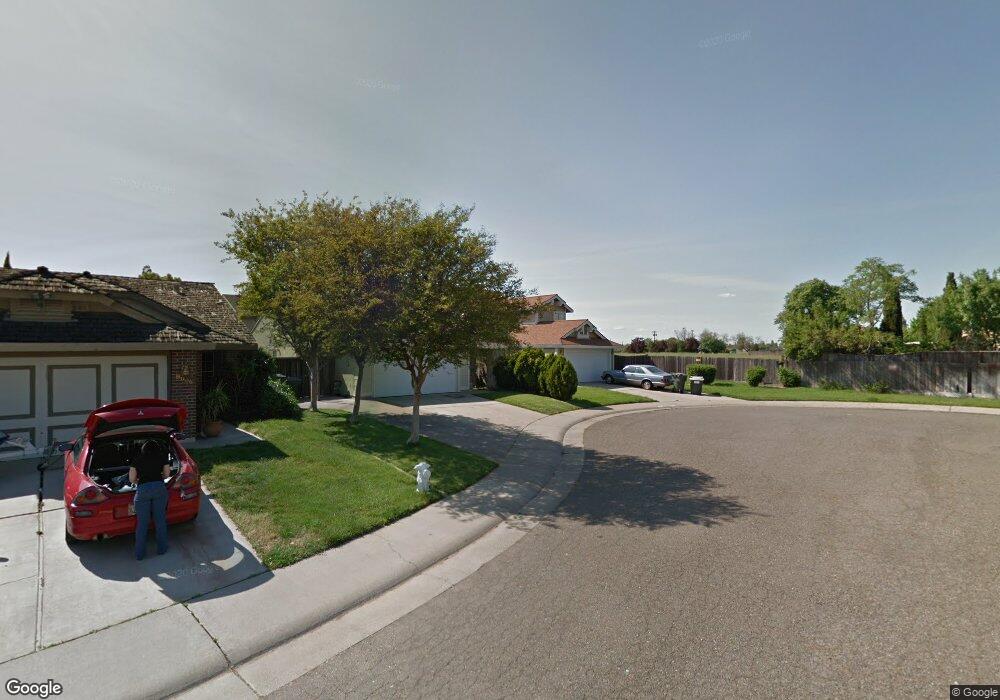
8000 Benz Ct Sacramento, CA 95828
Estimated Value: $344,000 - $502,000
4
Beds
3
Baths
1,588
Sq Ft
$288/Sq Ft
Est. Value
About This Home
This home is located at 8000 Benz Ct, Sacramento, CA 95828 and is currently estimated at $457,430, approximately $288 per square foot. 8000 Benz Ct is a home located in Sacramento County with nearby schools including Mary Tsukamoto Elementary School, T. R. Smedberg Middle School, and Sheldon High School.
Ownership History
Date
Name
Owned For
Owner Type
Purchase Details
Closed on
May 12, 2005
Sold by
Hadden Felicia
Bought by
Hadden Felicia L
Current Estimated Value
Purchase Details
Closed on
Jan 18, 2001
Sold by
Vu Tu Nhu
Bought by
Hadden Felicia
Home Financials for this Owner
Home Financials are based on the most recent Mortgage that was taken out on this home.
Original Mortgage
$150,250
Outstanding Balance
$54,914
Interest Rate
7.41%
Estimated Equity
$402,516
Purchase Details
Closed on
Aug 26, 1998
Sold by
Hud
Bought by
Vu Tu Nhu
Home Financials for this Owner
Home Financials are based on the most recent Mortgage that was taken out on this home.
Original Mortgage
$123,978
Interest Rate
6.91%
Mortgage Type
FHA
Purchase Details
Closed on
Feb 24, 1998
Sold by
Breaux Mark P and Breaux Judy M
Bought by
First Nationwide Mtg Corp
Purchase Details
Closed on
Dec 3, 1997
Sold by
First Nationwide Mtg Corp
Bought by
Hud
Create a Home Valuation Report for This Property
The Home Valuation Report is an in-depth analysis detailing your home's value as well as a comparison with similar homes in the area
Home Values in the Area
Average Home Value in this Area
Purchase History
| Date | Buyer | Sale Price | Title Company |
|---|---|---|---|
| Hadden Felicia L | -- | Ticor Title Company | |
| Hadden Felicia | $155,000 | Fidelity National Title Co | |
| Vu Tu Nhu | $125,000 | Stewart Title | |
| First Nationwide Mtg Corp | $90,834 | Fidelity National Title Ins | |
| Hud | -- | -- |
Source: Public Records
Mortgage History
| Date | Status | Borrower | Loan Amount |
|---|---|---|---|
| Open | Hadden Felicia | $150,250 | |
| Previous Owner | Vu Tu Nhu | $123,978 |
Source: Public Records
Tax History Compared to Growth
Tax History
| Year | Tax Paid | Tax Assessment Tax Assessment Total Assessment is a certain percentage of the fair market value that is determined by local assessors to be the total taxable value of land and additions on the property. | Land | Improvement |
|---|---|---|---|---|
| 2025 | $2,537 | $233,387 | $54,234 | $179,153 |
| 2024 | $2,537 | $228,812 | $53,171 | $175,641 |
| 2023 | $2,474 | $224,327 | $52,129 | $172,198 |
| 2022 | $2,432 | $219,929 | $51,107 | $168,822 |
| 2021 | $2,404 | $215,617 | $50,105 | $165,512 |
| 2020 | $2,372 | $213,407 | $49,592 | $163,815 |
| 2019 | $2,329 | $209,223 | $48,620 | $160,603 |
| 2018 | $2,268 | $205,121 | $47,667 | $157,454 |
| 2017 | $2,228 | $201,100 | $46,733 | $154,367 |
| 2016 | $2,118 | $197,158 | $45,817 | $151,341 |
| 2015 | $2,079 | $194,197 | $45,129 | $149,068 |
| 2014 | $2,044 | $190,393 | $44,245 | $146,148 |
Source: Public Records
Map
Nearby Homes
- 8034 Kelty Ct
- 8005 Delage Way
- 8716 Cord Way
- 8798 Caselman Rd
- 8916 Hollowstone Way
- 8880 Sonoma Valley Way
- 8247 Derbyshire Cir
- 8170 Derbyshire Cir
- 8733 Nakota Way
- 7790 Finnhorse Way
- 8837 Navarrin Way
- 7926 Asiatic Lion Ct
- 8695 Esperia Way
- 8800 Tiogawoods Dr
- 8932 Caselman Rd
- 8977 Carlisle Ave
- 8159 Morgan Hill Way
- 8510 Cavendish Way
- 8609 Tiogawoods Dr
- 8901 Leland Ave