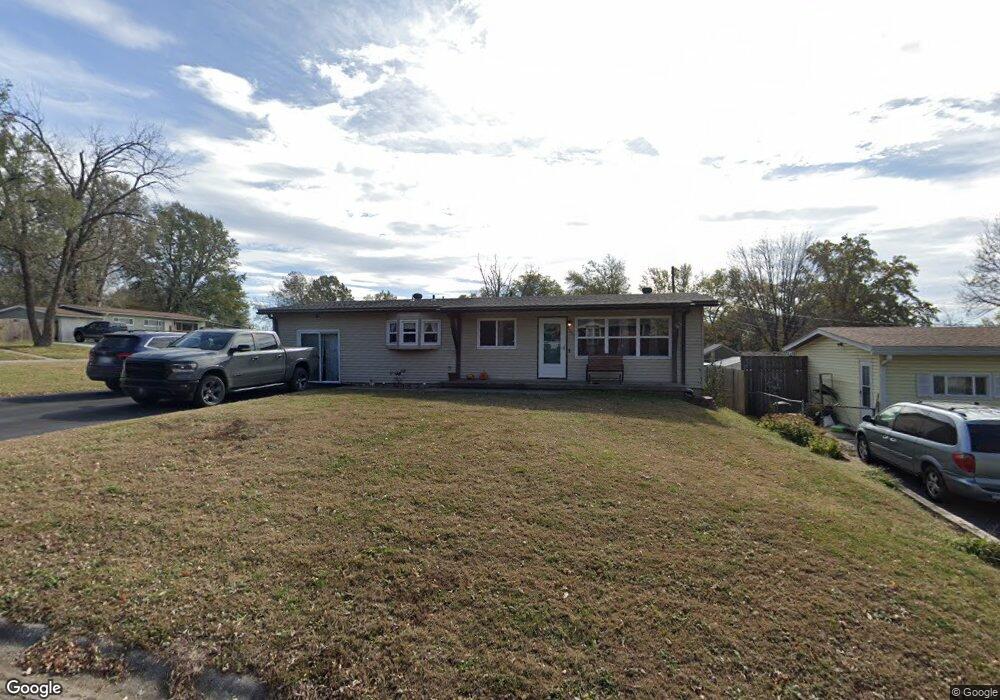
8001 Ohio Ave Kansas City, KS 66112
Muncie NeighborhoodEstimated Value: $206,000 - $251,000
5
Beds
2
Baths
1,300
Sq Ft
$175/Sq Ft
Est. Value
About This Home
This home is located at 8001 Ohio Ave, Kansas City, KS 66112 and is currently estimated at $226,917, approximately $174 per square foot. 8001 Ohio Ave is a home located in Wyandotte County with nearby schools including Stony Point South Elementary, Arrowhead Middle School, and Washington High School.
Ownership History
Date
Name
Owned For
Owner Type
Purchase Details
Closed on
Nov 29, 2018
Sold by
Pittman Luke A and Pittman Jaclyn A
Bought by
Pittman Luke A and Pittman Jaclyn A
Current Estimated Value
Purchase Details
Closed on
Aug 8, 2013
Sold by
Pittman Luke A and Pittman Jaclyn A
Bought by
Pittman Luke A and Pittman Jaclyn A
Home Financials for this Owner
Home Financials are based on the most recent Mortgage that was taken out on this home.
Original Mortgage
$115,496
Outstanding Balance
$85,925
Interest Rate
4.4%
Mortgage Type
FHA
Estimated Equity
$140,993
Purchase Details
Closed on
Dec 10, 2008
Sold by
Pittman Luke A and Pittman Jaclyn A
Bought by
Pittman Luke A and Pittman Jaclyn A
Home Financials for this Owner
Home Financials are based on the most recent Mortgage that was taken out on this home.
Original Mortgage
$123,438
Interest Rate
6.19%
Mortgage Type
FHA
Purchase Details
Closed on
Jan 17, 2003
Sold by
Killian Jerry D and Killian Annetta L
Bought by
Pittman Luke A and Pittman Jacklyn A
Home Financials for this Owner
Home Financials are based on the most recent Mortgage that was taken out on this home.
Original Mortgage
$93,223
Interest Rate
6%
Create a Home Valuation Report for This Property
The Home Valuation Report is an in-depth analysis detailing your home's value as well as a comparison with similar homes in the area
Home Values in the Area
Average Home Value in this Area
Purchase History
| Date | Buyer | Sale Price | Title Company |
|---|---|---|---|
| Pittman Luke A | -- | None Available | |
| Pittman Luke A | -- | Secured Title Of Kansas | |
| Pittman Luke A | -- | -- | |
| Pittman Luke A | -- | -- |
Source: Public Records
Mortgage History
| Date | Status | Borrower | Loan Amount |
|---|---|---|---|
| Open | Pittman Luke A | $115,496 | |
| Previous Owner | Pittman Luke A | $123,438 | |
| Previous Owner | Pittman Luke A | $93,223 |
Source: Public Records
Tax History Compared to Growth
Tax History
| Year | Tax Paid | Tax Assessment Tax Assessment Total Assessment is a certain percentage of the fair market value that is determined by local assessors to be the total taxable value of land and additions on the property. | Land | Improvement |
|---|---|---|---|---|
| 2024 | $3,039 | $20,677 | $4,118 | $16,559 |
| 2023 | $3,158 | $19,792 | $3,381 | $16,411 |
| 2022 | $2,635 | $16,479 | $2,976 | $13,503 |
| 2021 | $2,366 | $14,398 | $2,872 | $11,526 |
| 2020 | $2,283 | $13,903 | $2,301 | $11,602 |
| 2019 | $2,087 | $12,738 | $1,979 | $10,759 |
| 2018 | $1,850 | $11,374 | $1,387 | $9,987 |
| 2017 | $1,845 | $11,243 | $1,387 | $9,856 |
| 2016 | $1,738 | $10,507 | $1,387 | $9,120 |
| 2015 | $1,707 | $10,201 | $1,387 | $8,814 |
| 2014 | $1,762 | $9,660 | $1,556 | $8,104 |
Source: Public Records
Map
Nearby Homes
- 355 N 81st Terrace
- 7849 Splitlog Ave
- 7901 Ella Ave
- 7904 Ella Ave
- 429 N 81st Terrace
- 518 N 82nd St
- 533 N 83rd St
- 554 N 78th St
- 100 S 78th St
- 100 S 78th St
- 7614 Riverview Ave
- 7617 Riverview Ave
- 8427 Sandusky Ave
- 7710 Speaker Rd
- 449 N 86th St
- 8210 Ann Ave
- 8241 Armstrong Ave
- 8539 Sandusky Ave
- 8516 Barnett Ave
- 845 N 84th St
- 8005 Ohio Ave
- 8000 Northrup Ave
- 8006 Northrup Ave
- 300 N 80th Terrace
- 229 N 80th Terrace
- 8009 Ohio Ave
- 223 N 80th Terrace
- 8012 Northrup Ave
- 219 N 80th Terrace
- 8006 Ohio Ave
- 301 N 80th Terrace
- 306 N 80th Terrace
- 8015 Ohio Ave
- 8018 Northrup Ave
- 215 N 80th Terrace
- 8012 Ohio Ave
- 307 N 80th Terrace
- 8001 Northrup Ave
- 8007 Northrup Ave
- 8024 Northrup Ave