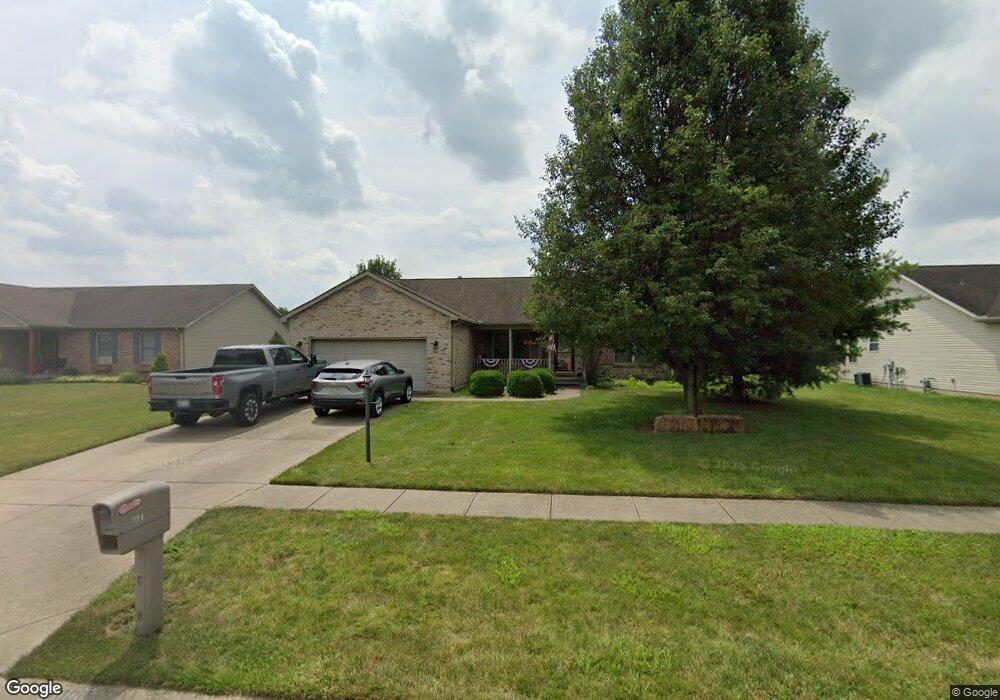
8001 Timberwind Trail Franklin, OH 45005
Estimated Value: $290,256 - $308,000
3
Beds
2
Baths
1,590
Sq Ft
$189/Sq Ft
Est. Value
About This Home
This home is located at 8001 Timberwind Trail, Franklin, OH 45005 and is currently estimated at $300,314, approximately $188 per square foot. 8001 Timberwind Trail is a home located in Warren County with nearby schools including Alden R Brown Elementary School, Chamberlain Middle School, and Carlisle High School.
Ownership History
Date
Name
Owned For
Owner Type
Purchase Details
Closed on
Apr 21, 2006
Sold by
Dawson Alfred E and Dawson Phyllis A
Bought by
Tarter Jerry D and Tarter Melissa G
Current Estimated Value
Home Financials for this Owner
Home Financials are based on the most recent Mortgage that was taken out on this home.
Original Mortgage
$128,000
Outstanding Balance
$72,169
Interest Rate
6.42%
Mortgage Type
Fannie Mae Freddie Mac
Estimated Equity
$228,145
Purchase Details
Closed on
May 13, 2005
Sold by
Timberwind Llc
Bought by
Dawson Alfred E and Dawson Phyllis A
Home Financials for this Owner
Home Financials are based on the most recent Mortgage that was taken out on this home.
Original Mortgage
$125,000
Interest Rate
6.05%
Mortgage Type
Construction
Create a Home Valuation Report for This Property
The Home Valuation Report is an in-depth analysis detailing your home's value as well as a comparison with similar homes in the area
Home Values in the Area
Average Home Value in this Area
Purchase History
| Date | Buyer | Sale Price | Title Company |
|---|---|---|---|
| Tarter Jerry D | $160,000 | None Available | |
| Dawson Alfred E | $27,000 | Advantage Title Co |
Source: Public Records
Mortgage History
| Date | Status | Borrower | Loan Amount |
|---|---|---|---|
| Open | Tarter Jerry D | $128,000 | |
| Closed | Dawson Alfred E | $125,000 |
Source: Public Records
Tax History
| Year | Tax Paid | Tax Assessment Tax Assessment Total Assessment is a certain percentage of the fair market value that is determined by local assessors to be the total taxable value of land and additions on the property. | Land | Improvement |
|---|---|---|---|---|
| 2025 | $3,053 | $78,340 | $21,000 | $57,340 |
| 2024 | $3,053 | $78,340 | $21,000 | $57,340 |
| 2023 | $2,263 | $53,270 | $6,447 | $46,823 |
| 2022 | $2,247 | $53,270 | $6,447 | $46,823 |
| 2021 | $2,170 | $53,270 | $6,447 | $46,823 |
| 2020 | $2,195 | $47,142 | $5,705 | $41,437 |
| 2019 | $2,224 | $47,142 | $5,705 | $41,437 |
| 2018 | $2,157 | $47,142 | $5,705 | $41,437 |
| 2017 | $2,247 | $44,020 | $5,324 | $38,696 |
| 2016 | $1,961 | $44,020 | $5,324 | $38,696 |
| 2015 | $1,966 | $44,020 | $5,324 | $38,696 |
| 2014 | $1,747 | $38,610 | $4,670 | $33,940 |
| 2013 | $1,673 | $47,190 | $5,710 | $41,480 |
Source: Public Records
Map
Nearby Homes
- 7368 Timber Wolf Dr
- 7548 Timber Valley Dr
- 1225 Waterbury Dr
- 7869 Dubois Rd
- 7958 Dubois Rd
- 210 Baker Ln
- 7315 Franklin Trenton Rd
- 8680 Plum Creek Ct
- 8715 Plum Creek Ct
- 7822 Dian Ave
- 8737 Appleridge Ct
- 7312 Pinewood Dr
- 0 Oxford Rd
- 90 Timber Creek Dr
- 1223 Waterbury Dr
- 1215 Waterbury Dr
- 8677 Oriole Dr
- 650 Beachler Dr
- 6711 Hamilton Middletown Rd
- 4422 Riviera Dr
- 7983 Timberwind Trail
- 8019 Timberwind Trail
- Lot Timberwind Trail
- Lot 23 Timberwind Trail
- Lot 24 Timberwind Trail
- 0 Timberwind Trail Unit 494874
- 0 Timberwind Trail Unit Lt 39 1174356
- 0 Timberwind Trail Unit Lot 73
- 0 Timberwind Trail Unit Lot 39
- 0 Timberwind Trail Unit Lot 24
- 0 Timberwind Trail Unit Lot 12 727271
- 40 Timberwind Trail
- 7965 Timberwind Trail
- 8037 Timberwind Trail
- 7945 Timberwind Trail
- 8002 Timberwind Trail
- 7984 Timberwind Trail
- 8020 Timberwind Trail
- 7426 Martz Paulin Rd
- 8057 Timberwind Trail
Your Personal Tour Guide
Ask me questions while you tour the home.