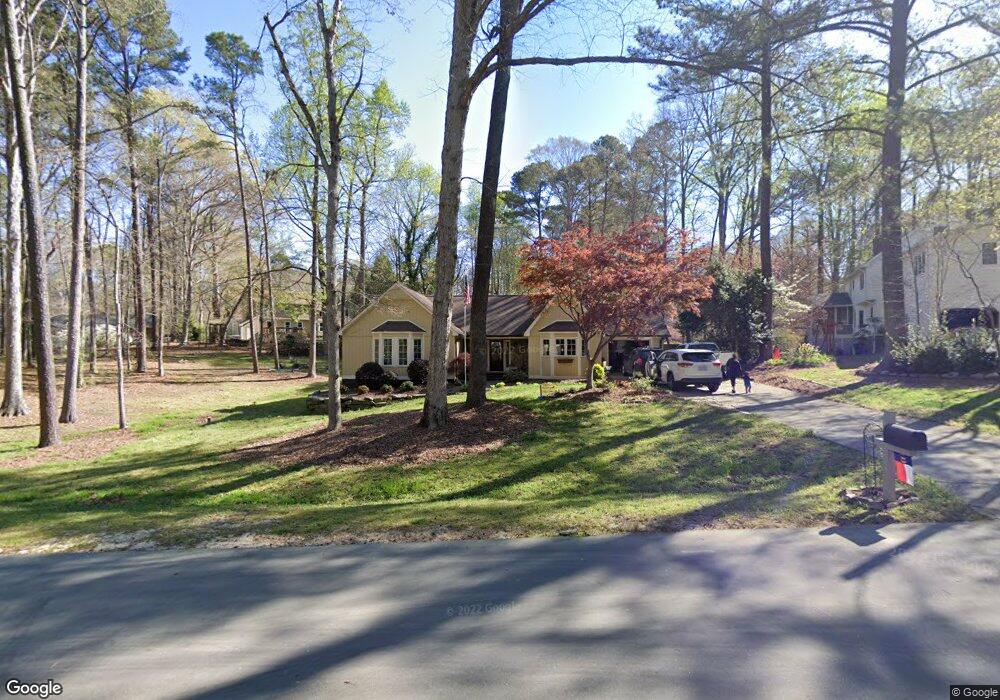
8004 Chadbourne Ct Raleigh, NC 27613
Stonehenge NeighborhoodEstimated Value: $548,000 - $654,000
3
Beds
2
Baths
1,667
Sq Ft
$370/Sq Ft
Est. Value
About This Home
This home is located at 8004 Chadbourne Ct, Raleigh, NC 27613 and is currently estimated at $616,178, approximately $369 per square foot. 8004 Chadbourne Ct is a home located in Wake County with nearby schools including Jeffreys Grove Elementary School, Carroll Middle, and Sanderson High School.
Ownership History
Date
Name
Owned For
Owner Type
Purchase Details
Closed on
Apr 15, 2021
Sold by
Badgley Zachary Lewis and Badgley Nicole Frisco
Bought by
Badgley Zachary Lewis and Badgley Nicole Frisco
Current Estimated Value
Home Financials for this Owner
Home Financials are based on the most recent Mortgage that was taken out on this home.
Original Mortgage
$284,700
Outstanding Balance
$213,709
Interest Rate
3%
Mortgage Type
New Conventional
Estimated Equity
$402,469
Purchase Details
Closed on
Jun 13, 2018
Sold by
Vinson Jeffrey M and Vinson Caroline H
Bought by
Badgley Zachary Lewis and Frisco Nicole Elise
Home Financials for this Owner
Home Financials are based on the most recent Mortgage that was taken out on this home.
Original Mortgage
$297,500
Interest Rate
4.5%
Mortgage Type
New Conventional
Purchase Details
Closed on
Apr 29, 2005
Sold by
Hein Barbara
Bought by
Serpa Nicholas
Home Financials for this Owner
Home Financials are based on the most recent Mortgage that was taken out on this home.
Original Mortgage
$215,000
Interest Rate
7.65%
Mortgage Type
Fannie Mae Freddie Mac
Create a Home Valuation Report for This Property
The Home Valuation Report is an in-depth analysis detailing your home's value as well as a comparison with similar homes in the area
Home Values in the Area
Average Home Value in this Area
Purchase History
| Date | Buyer | Sale Price | Title Company |
|---|---|---|---|
| Badgley Zachary Lewis | -- | Title 365 Inc | |
| Badgley Zachary Lewis | $350,000 | None Available | |
| Serpa Nicholas | $209,000 | -- |
Source: Public Records
Mortgage History
| Date | Status | Borrower | Loan Amount |
|---|---|---|---|
| Open | Badgley Zachary Lewis | $284,700 | |
| Closed | Badgley Zachary Lewis | $297,500 | |
| Previous Owner | Serpa Nicholas | $215,000 |
Source: Public Records
Tax History Compared to Growth
Tax History
| Year | Tax Paid | Tax Assessment Tax Assessment Total Assessment is a certain percentage of the fair market value that is determined by local assessors to be the total taxable value of land and additions on the property. | Land | Improvement |
|---|---|---|---|---|
| 2025 | $3,944 | $613,535 | $200,000 | $413,535 |
| 2024 | $3,461 | $613,535 | $200,000 | $413,535 |
| 2023 | $2,651 | $337,451 | $100,000 | $237,451 |
| 2022 | $2,457 | $337,451 | $100,000 | $237,451 |
| 2021 | $2,391 | $337,451 | $100,000 | $237,451 |
| 2020 | $2,352 | $337,451 | $100,000 | $237,451 |
| 2019 | $2,352 | $285,597 | $100,000 | $185,597 |
| 2018 | $2,163 | $285,597 | $100,000 | $185,597 |
| 2017 | $0 | $285,597 | $100,000 | $185,597 |
| 2016 | $2,009 | $285,597 | $100,000 | $185,597 |
| 2015 | $1,805 | $257,054 | $86,000 | $171,054 |
| 2014 | $1,711 | $257,054 | $86,000 | $171,054 |
Source: Public Records
Map
Nearby Homes
- 2704 Smokey Ridge Rd
- 8404 Sleepy Creek Dr
- 8100 Laurel Mountain Rd
- 7628 Valview St
- 7740 Wilderness Rd
- 7741 Wilderness Rd
- 8605 Brookdale Dr
- 3008 Eden Harbor Ct
- 7771 Falcon Rest Cir Unit 7771
- 8604 Wellsley Way
- 7601 Valview St
- 2610 Sawmill Rd
- 8920 Taymouth Ct
- 7401 Ray Rd
- 2204 Middlefield Ct
- 2609 Cobworth Ct
- 2428 Havershire Dr
- 8326 Ray Rd
- 7922 Footman Way
- 6901 Saxby Ct
- 2712 Scottsdale Ln
- 8008 Chadbourne Ct
- 2708 Scottsdale Ln
- 2709 Salisbury Plain
- 2707 Salisbury Plain
- 2716 Scottsdale Ln
- 8009 Chadbourne Ct
- 2717 Salisbury Plain
- 8005 Chadbourne Ct
- 2704 Scottsdale Ln
- 2721 Salisbury Plain
- 2705 Salisbury Plain
- 2720 Scottsdale Ln
- 2713 Scottsdale Ln
- 2717 Scottsdale Ln
- 2709 Scottsdale Ln
- 2716 Salisbury Plain
- 2712 Salisbury Plain
- 8124 N Creek Run
- 2725 Salisbury Plain