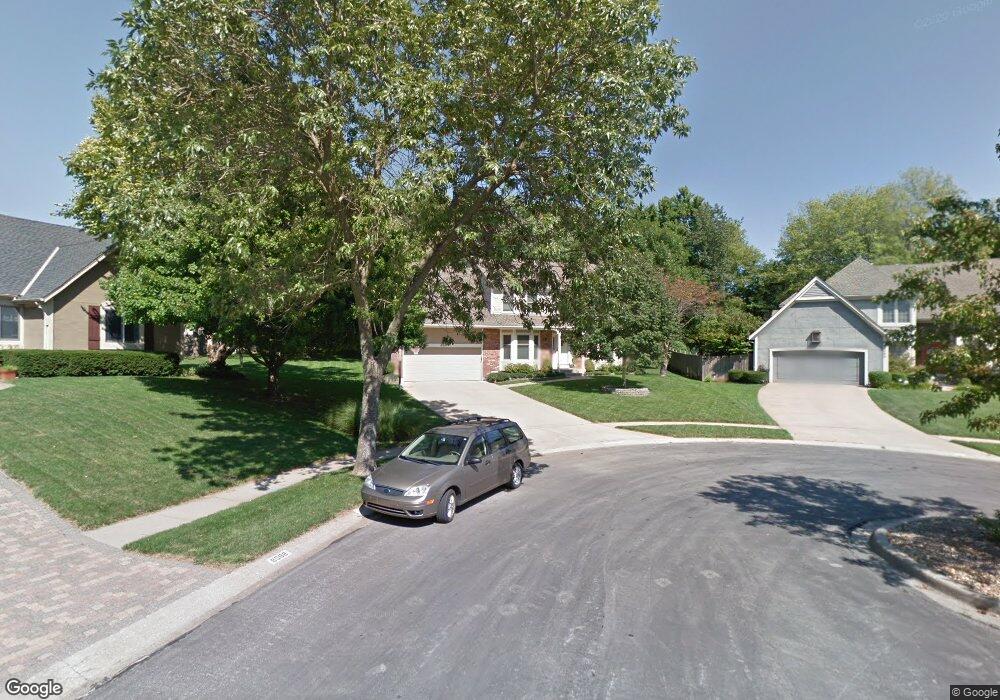
8004 Constance St Lenexa, KS 66215
Estimated Value: $513,000 - $540,958
4
Beds
3
Baths
2,644
Sq Ft
$199/Sq Ft
Est. Value
About This Home
This home is located at 8004 Constance St, Lenexa, KS 66215 and is currently estimated at $525,740, approximately $198 per square foot. 8004 Constance St is a home located in Johnson County with nearby schools including Rising Star Elementary School, Westridge Middle School, and Shawnee Mission West High School.
Ownership History
Date
Name
Owned For
Owner Type
Purchase Details
Closed on
Apr 13, 2023
Sold by
Kendrick Lisbeth Joan and Kendrick John Bryan
Bought by
John Bryan Kendrick And Lisbeth Joan Kendrick
Current Estimated Value
Purchase Details
Closed on
May 19, 2017
Sold by
Kendrick Lisbeth J and Kendrick John B
Bought by
Kendrick John Bryan and Kendrick Lisbeth Joan
Purchase Details
Closed on
Feb 11, 2005
Sold by
Palmer Archie Cecil
Bought by
Kendrick John B and Kendrick Lisbeth J
Home Financials for this Owner
Home Financials are based on the most recent Mortgage that was taken out on this home.
Original Mortgage
$203,200
Interest Rate
5.77%
Mortgage Type
New Conventional
Purchase Details
Closed on
May 20, 2002
Sold by
Palmer Archie C and Palmer Vaunda L
Bought by
Palmer Archie Cecil and Palmer Vaunda L
Create a Home Valuation Report for This Property
The Home Valuation Report is an in-depth analysis detailing your home's value as well as a comparison with similar homes in the area
Home Values in the Area
Average Home Value in this Area
Purchase History
| Date | Buyer | Sale Price | Title Company |
|---|---|---|---|
| John Bryan Kendrick And Lisbeth Joan Kendrick | -- | None Listed On Document | |
| Kendrick Lisbeth Joan | -- | None Listed On Document | |
| Kendrick John Bryan | -- | None Available | |
| Kendrick John B | -- | Kansas Secured Title | |
| Palmer Archie Cecil | -- | -- |
Source: Public Records
Mortgage History
| Date | Status | Borrower | Loan Amount |
|---|---|---|---|
| Previous Owner | Kendrick John B | $203,200 |
Source: Public Records
Tax History Compared to Growth
Tax History
| Year | Tax Paid | Tax Assessment Tax Assessment Total Assessment is a certain percentage of the fair market value that is determined by local assessors to be the total taxable value of land and additions on the property. | Land | Improvement |
|---|---|---|---|---|
| 2024 | $5,958 | $53,739 | $9,815 | $43,924 |
| 2023 | $5,723 | $50,864 | $9,815 | $41,049 |
| 2022 | $5,147 | $45,712 | $8,536 | $37,176 |
| 2021 | $4,839 | $40,836 | $8,121 | $32,715 |
| 2020 | $4,707 | $39,330 | $8,121 | $31,209 |
| 2019 | $4,554 | $38,030 | $8,121 | $29,909 |
| 2018 | $4,751 | $39,353 | $8,121 | $31,232 |
| 2017 | $4,161 | $33,361 | $6,412 | $26,949 |
| 2016 | $4,253 | $33,695 | $6,412 | $27,283 |
| 2015 | $4,010 | $31,981 | $6,412 | $25,569 |
| 2013 | -- | $29,210 | $6,412 | $22,798 |
Source: Public Records
Map
Nearby Homes
- 14828 W 83rd Place
- 14915 W 84th Terrace
- 14620 W 84th St
- 15322 W 83rd St
- 8403 Swarner Dr
- 8033 Hall St
- 15322 W 83rd Terrace
- 15615 W 81st St
- 14424 W 84th Terrace
- 15529 W 83rd Terrace
- 8616 Baska Ct
- 15710 W 84th Terrace
- 8641 Greenwood Ln
- 13716 W 75th Terrace
- 7325 Oakview St
- 15611 W 86th St
- 13800 W 75th Ct
- 7219 Allman Rd
- 7239 Allman Rd
- 7221 Allman Rd
- 8005 Constance St
- 8008 Constance St
- 14731 W 79th Terrace
- 14725 W 79th Terrace
- 14737 W 79th Terrace
- 8012 Constance St
- 7951 Lingle Ln
- 14732 W 80th St
- 8009 Constance St
- 14726 W 80th St
- 14719 W 79th Terrace
- 8015 Constance St
- 8003 Lingle Ln
- 8016 Constance St
- 14720 W 80th St
- 14738 W 80th St
- 8009 Lingle Ln
- 14713 W 79th Terrace
- 7945 Randall Dr
- 8021 Constance St