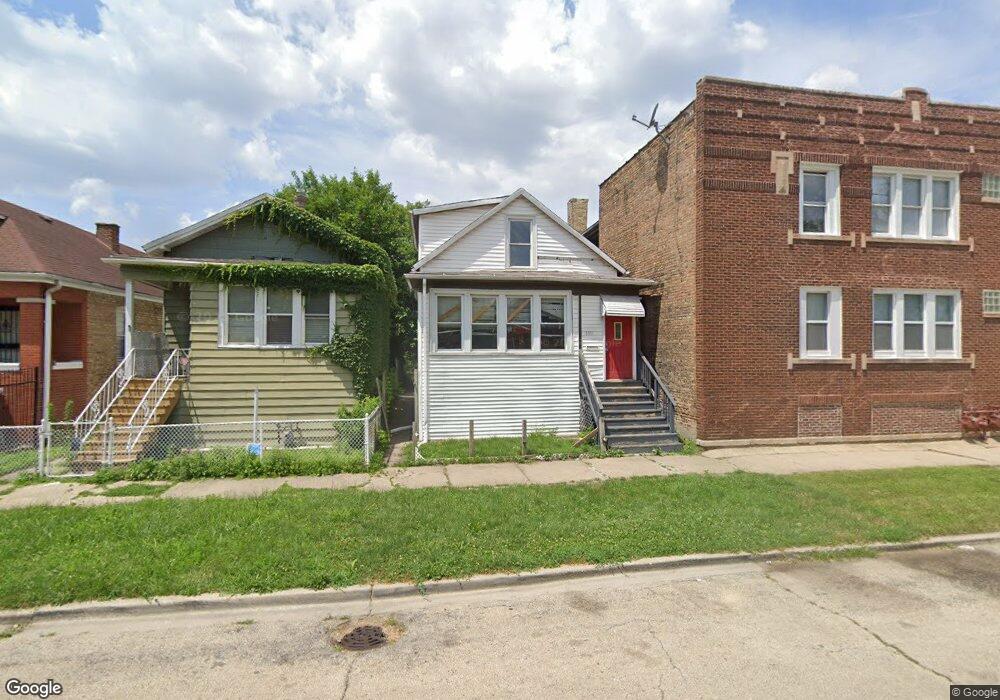
8004 S Union Ave Chicago, IL 60620
Auburn Gresham NeighborhoodEstimated Value: $132,000 - $166,000
3
Beds
2
Baths
1,119
Sq Ft
$133/Sq Ft
Est. Value
About This Home
This home is located at 8004 S Union Ave, Chicago, IL 60620 and is currently estimated at $148,736, approximately $132 per square foot. 8004 S Union Ave is a home located in Cook County with nearby schools including Westcott Elementary School, Emil G. Hirsch Metropolitan High School, and Community Youth Development Institute.
Ownership History
Date
Name
Owned For
Owner Type
Purchase Details
Closed on
Oct 22, 2012
Sold by
The Chicago Trust Company Na
Bought by
E & S Blessed Investments Llc
Current Estimated Value
Purchase Details
Closed on
Jan 14, 2009
Sold by
Park National Bank
Bought by
Wayne Hummer Trust Company Na and Trust #Bev-2986
Purchase Details
Closed on
May 2, 2008
Sold by
Liquidation Properties Inc
Bought by
Park National Trust #32267
Purchase Details
Closed on
May 30, 2007
Sold by
Booker Bobby
Bought by
Liquidation Properties Inc
Purchase Details
Closed on
Mar 17, 2006
Sold by
Didenko Andre
Bought by
Booker Bobby
Home Financials for this Owner
Home Financials are based on the most recent Mortgage that was taken out on this home.
Original Mortgage
$112,500
Interest Rate
9.52%
Mortgage Type
Balloon
Purchase Details
Closed on
Jan 28, 2005
Sold by
Xez
Bought by
Didenko Andre
Purchase Details
Closed on
Sep 1, 2004
Sold by
Lasalle Bank Na
Bought by
Xez Inc
Create a Home Valuation Report for This Property
The Home Valuation Report is an in-depth analysis detailing your home's value as well as a comparison with similar homes in the area
Home Values in the Area
Average Home Value in this Area
Purchase History
| Date | Buyer | Sale Price | Title Company |
|---|---|---|---|
| E & S Blessed Investments Llc | $7,000 | None Available | |
| Wayne Hummer Trust Company Na | $23,000 | None Available | |
| Park National Trust #32267 | $13,000 | First American Title | |
| Liquidation Properties Inc | -- | None Available | |
| Booker Bobby | $125,000 | First American Title Ins Co | |
| Didenko Andre | $110,000 | -- | |
| Xez Inc | $50,000 | Cti |
Source: Public Records
Mortgage History
| Date | Status | Borrower | Loan Amount |
|---|---|---|---|
| Previous Owner | Booker Bobby | $112,500 |
Source: Public Records
Tax History Compared to Growth
Tax History
| Year | Tax Paid | Tax Assessment Tax Assessment Total Assessment is a certain percentage of the fair market value that is determined by local assessors to be the total taxable value of land and additions on the property. | Land | Improvement |
|---|---|---|---|---|
| 2024 | $816 | $7,741 | $1,563 | $6,178 |
| 2023 | $795 | $3,867 | $2,344 | $1,523 |
| 2022 | $795 | $3,867 | $2,344 | $1,523 |
| 2021 | $777 | $3,866 | $2,343 | $1,523 |
| 2020 | $1,876 | $8,423 | $2,343 | $6,080 |
| 2019 | $1,860 | $9,256 | $2,343 | $6,913 |
| 2018 | $1,828 | $9,256 | $2,343 | $6,913 |
| 2017 | $1,484 | $6,895 | $2,031 | $4,864 |
| 2016 | $1,381 | $6,895 | $2,031 | $4,864 |
| 2015 | $1,263 | $6,895 | $2,031 | $4,864 |
| 2014 | $1,211 | $6,528 | $1,875 | $4,653 |
| 2013 | $1,187 | $6,528 | $1,875 | $4,653 |
Source: Public Records
Map
Nearby Homes
- 639 W 80th St
- 7924 S Lowe Ave
- 652 W 81st St
- 8027 S Green St
- 7815 S Emerald Ave
- 7912 S Parnell Ave
- 7926 S Peoria St
- 517 W Winneconna Pkwy
- 8022 S Peoria St
- 507 W 79th St
- 7955 S Sangamon St
- 8019 S Sangamon St
- 8037 S Sangamon St
- 8125 S Peoria St
- 503 W 81st St
- 8144 S Green St
- 7800 S Peoria St
- 414 W 79th Place
- 8059 S Morgan St
- 7732 S Normal Ave
- 8006 S Union Ave
- 701 W 80th St Unit 9
- 8010 S Union Ave
- 8012 S Union Ave
- 8014 S Union Ave
- 8016 S Union Ave
- 8018 S Union Ave
- 8005 S Emerald Ave
- 8001 S Emerald Ave
- 8007 S Emerald Ave
- 8020 S Union Ave
- 7956 S Union Ave
- 8011 S Emerald Ave
- 8013 S Emerald Ave
- 8022 S Union Ave
- 8015 S Emerald Ave
- 8017 S Emerald Ave
- 8024 S Union Ave
- 8001 S Union Ave
- 8019 S Emerald Ave