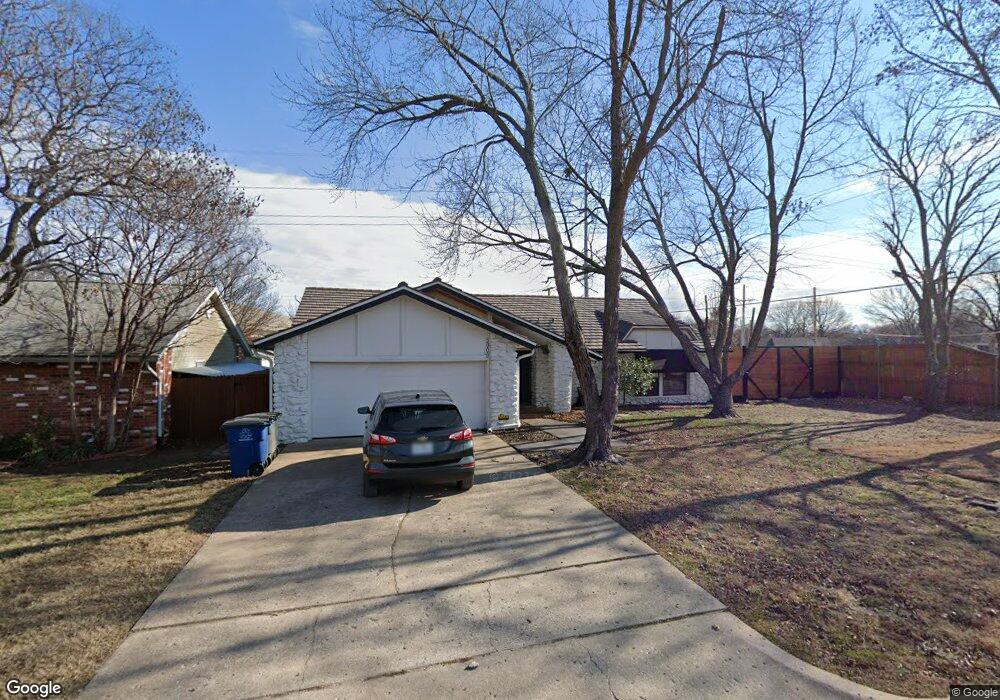
8009 S 72nd East Ave Tulsa, OK 74133
Sheridan Valley NeighborhoodEstimated Value: $244,053 - $254,000
3
Beds
2
Baths
1,749
Sq Ft
$143/Sq Ft
Est. Value
About This Home
This home is located at 8009 S 72nd East Ave, Tulsa, OK 74133 and is currently estimated at $250,263, approximately $143 per square foot. 8009 S 72nd East Ave is a home located in Tulsa County with nearby schools including Darnaby Elementary School, Union 6th-7th Grade Center, and Union 8th Grade Center.
Ownership History
Date
Name
Owned For
Owner Type
Purchase Details
Closed on
Jun 25, 2021
Sold by
Hanks Ii Ricky Lee
Bought by
Crown Jewel Investments Llc
Current Estimated Value
Purchase Details
Closed on
Jun 24, 2021
Sold by
Hanks Krystal Lynn and Hanks Ricky Lee
Bought by
R & K Revocable Trust
Purchase Details
Closed on
Oct 4, 2006
Sold by
Jackson David L and Jackson Jennifer L
Bought by
Hanks Ricky L and Hanks Krystal Lynn
Purchase Details
Closed on
Jan 1, 1992
Purchase Details
Closed on
Jul 1, 1984
Create a Home Valuation Report for This Property
The Home Valuation Report is an in-depth analysis detailing your home's value as well as a comparison with similar homes in the area
Home Values in the Area
Average Home Value in this Area
Purchase History
| Date | Buyer | Sale Price | Title Company |
|---|---|---|---|
| Crown Jewel Investments Llc | -- | None Listed On Document | |
| R & K Revocable Trust | -- | None Listed On Document | |
| Hanks Ricky L | $128,000 | None Available | |
| -- | $65,000 | -- | |
| -- | $80,000 | -- |
Source: Public Records
Tax History Compared to Growth
Tax History
| Year | Tax Paid | Tax Assessment Tax Assessment Total Assessment is a certain percentage of the fair market value that is determined by local assessors to be the total taxable value of land and additions on the property. | Land | Improvement |
|---|---|---|---|---|
| 2024 | $3,026 | $24,852 | $2,197 | $22,655 |
| 2023 | $3,026 | $23,668 | $2,310 | $21,358 |
| 2022 | $2,064 | $15,491 | $2,166 | $13,325 |
| 2021 | $1,991 | $14,753 | $2,063 | $12,690 |
| 2020 | $1,962 | $14,753 | $2,063 | $12,690 |
| 2019 | $2,031 | $14,753 | $2,063 | $12,690 |
| 2018 | $2,059 | $14,992 | $2,379 | $12,613 |
| 2017 | $1,973 | $14,279 | $2,266 | $12,013 |
| 2016 | $1,929 | $14,279 | $2,266 | $12,013 |
| 2015 | $1,950 | $14,279 | $2,266 | $12,013 |
| 2014 | $1,893 | $14,080 | $2,266 | $11,814 |
Source: Public Records
Map
Nearby Homes
- 8107 S 72nd Ave E
- 7104 E 81st Place
- 8239 S 73rd East Ave
- 6903 E 82nd St S
- 7755 S 73rd East Ave
- 6821 E 79th St
- 7743 S 73rd East Ave
- 6931 E 78th St
- 7410 E 84th St
- 8403 S 77th East Place
- 7736 S 69th East Ave
- 7336 E 84th Place
- 8517 E 77th Place
- 8623 S 73rd East Ave
- 7809 E 77th Place
- 7605 S Sheridan Rd
- 7327 E 75th St
- 7222 E 87th St
- 7954 S Lakewood Ave
- 8302 E 84th St
- 8003 S 72nd East Ave
- 7949 S 72nd East Ave
- 7128 E 80th St
- 7129 E 81st Place
- 8310 E 81st Place
- 7374 E 81st Place
- 7945 S 72nd Ave E
- 7125 E 81st Place
- 7122 E 80th St
- 7315 E 81st Place
- 7127 E 80th St
- 8107 S 72nd Ave E
- 7121 E 81st Place
- 7933 S 72nd East Ave
- 7116 E 80th St
- 7121 E 80th St
- 7936 S 72nd East Ave
- 7936 S 72nd Ave E
- 3022 E 81st Place
- 7115 E 81st Place