Estimated Value: $222,000 - $306,000
3
Beds
2
Baths
1,728
Sq Ft
$153/Sq Ft
Est. Value
About This Home
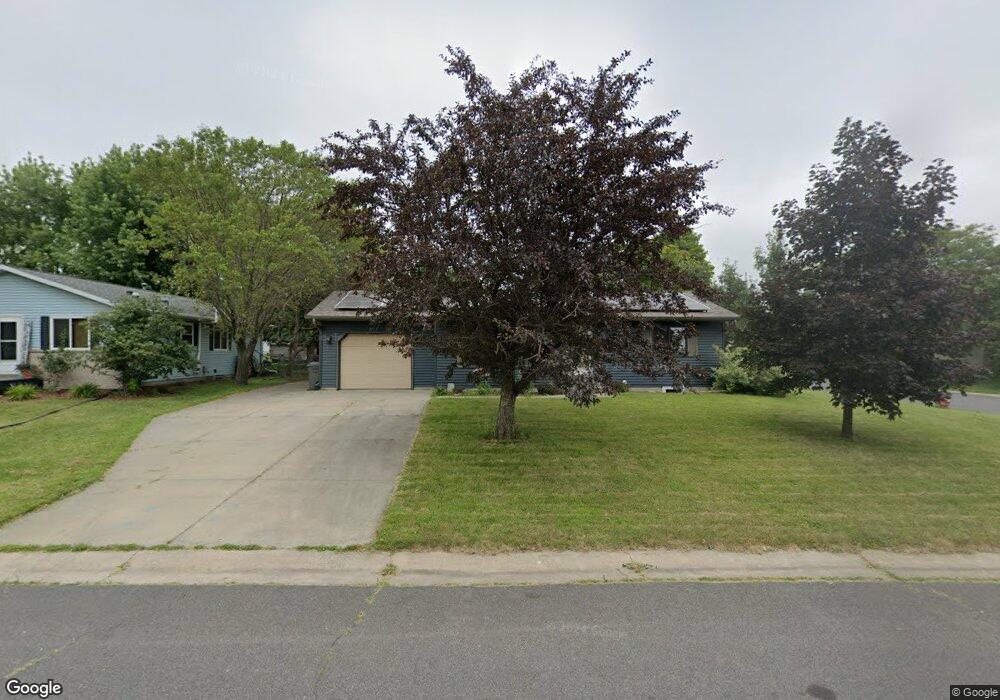
This home is located at 801 2nd St NW, Byron, MN 55920 and is currently estimated at $264,165, approximately $152 per square foot. 801 2nd St NW is a home located in Olmsted County with nearby schools including Byron Intermediate School, Byron Middle School, and Byron Senior High School.
Ownership History
Date
Name
Owned For
Owner Type
Purchase Details
Closed on
Oct 8, 2021
Sold by
Robards Daniel T and Robards Terry J
Bought by
Robards Ashley
Current Estimated Value
Home Financials for this Owner
Home Financials are based on the most recent Mortgage that was taken out on this home.
Original Mortgage
$177,151
Outstanding Balance
$161,545
Interest Rate
2.8%
Mortgage Type
FHA
Estimated Equity
$102,620
Purchase Details
Closed on
Oct 31, 2019
Sold by
Eggler Jodi L and Johnson James
Bought by
Robards Daniel T and Robards Terry J
Purchase Details
Closed on
May 29, 2012
Sold by
Eggler Jod L
Bought by
Eggler Jodi L and Johnson James
Home Financials for this Owner
Home Financials are based on the most recent Mortgage that was taken out on this home.
Original Mortgage
$91,000
Interest Rate
3.9%
Mortgage Type
New Conventional
Create a Home Valuation Report for This Property
The Home Valuation Report is an in-depth analysis detailing your home's value as well as a comparison with similar homes in the area
Home Values in the Area
Average Home Value in this Area
Purchase History
| Date | Buyer | Sale Price | Title Company |
|---|---|---|---|
| Robards Ashley | $180,421 | None Available | |
| Robards Daniel T | $180,421 | Rochester Title & Escrow Co | |
| Eggler Jodi L | -- | Rochester Title & Escrow Co |
Source: Public Records
Mortgage History
| Date | Status | Borrower | Loan Amount |
|---|---|---|---|
| Open | Robards Ashley | $177,151 | |
| Previous Owner | Eggler Jodi L | $91,000 |
Source: Public Records
Tax History Compared to Growth
Tax History
| Year | Tax Paid | Tax Assessment Tax Assessment Total Assessment is a certain percentage of the fair market value that is determined by local assessors to be the total taxable value of land and additions on the property. | Land | Improvement |
|---|---|---|---|---|
| 2024 | $3,536 | $241,300 | $45,000 | $196,300 |
| 2023 | $3,488 | $235,300 | $40,000 | $195,300 |
| 2022 | $3,214 | $229,300 | $40,000 | $189,300 |
| 2021 | $3,108 | $193,200 | $40,000 | $153,200 |
| 2020 | $2,466 | $180,400 | $40,000 | $140,400 |
| 2019 | $2,292 | $160,100 | $30,000 | $130,100 |
| 2018 | $1,956 | $148,300 | $30,000 | $118,300 |
| 2017 | $1,826 | $135,600 | $30,000 | $105,600 |
| 2016 | $1,680 | $98,600 | $15,800 | $82,800 |
| 2015 | $1,636 | $88,100 | $15,300 | $72,800 |
| 2014 | $1,498 | $89,200 | $15,400 | $73,800 |
| 2012 | -- | $88,300 | $15,330 | $72,970 |
Source: Public Records
Map
Nearby Homes
- 413 9th Ave NW
- 323 2nd St NW
- 320 1st St NW
- 1420 Voll Dr NW
- 910 Byron Ave N
- 925 Byron Ave N
- TBD 708th St
- 154 Somerby Pkwy NE
- 172 Somerby Pkwy NE
- 190 Somerby Pkwy NE
- 208 Somerby Pkwy NE
- 1005 4th Ave NE
- 105 Somerby Pkwy NE
- 226 Somerby Pkwy NE
- 1405 Somerby Pkwy NE
- 244 Somerby Pkwy NE
- 264 Somerby Pkwy NE
- 1413 Somerby Pkwy NE
- 1404 Somerby Pkwy NE
- 1412 Somerby Pkwy NE
- 805 805 2nd-Street-nw
- 805 2nd St NW
- 309 8th Ave NW
- 809 2nd St NW
- 804 3rd St NW
- 808 3rd St NW
- 119 8th Ave NW
- 713 2nd St NW
- 304 8th Ave NW
- 813 813 2nd-Street-nw
- 813 2nd St NW
- 804 2nd St NW
- 308 8th Ave NW
- 808 2nd St NW
- 709 2nd St NW
- 817 2nd St NW
- 312 8th Ave NW
- 812 2nd St NW
- 812 812 2nd-Street-
- 900 3rd St NW