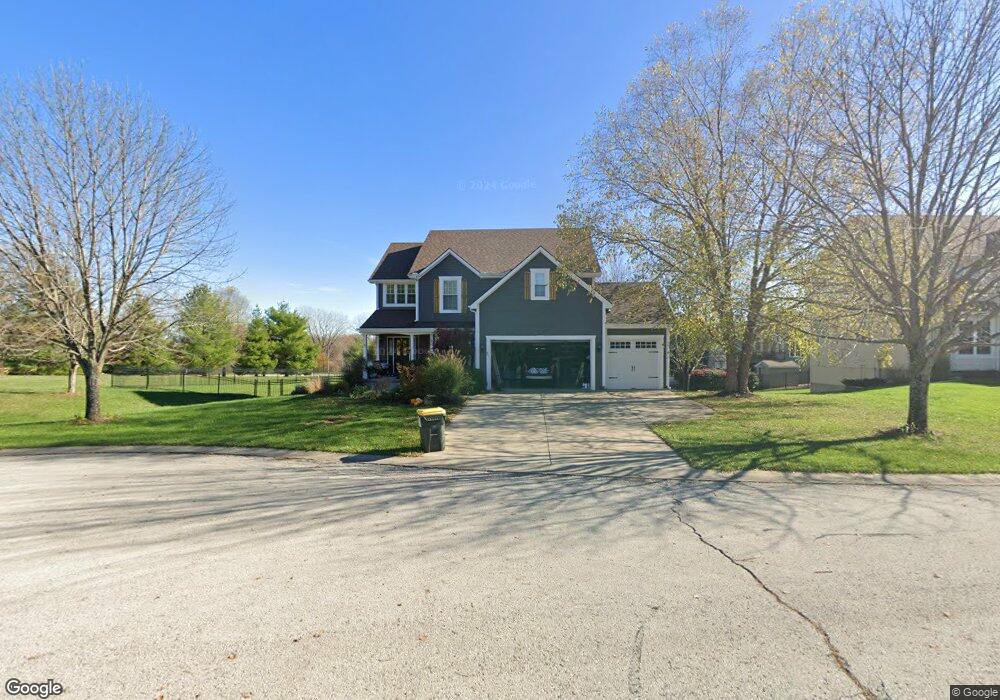
801 Blueberry Ct Lansing, KS 66043
Estimated Value: $419,000 - $431,000
5
Beds
4
Baths
2,554
Sq Ft
$166/Sq Ft
Est. Value
About This Home
This home is located at 801 Blueberry Ct, Lansing, KS 66043 and is currently estimated at $422,938, approximately $165 per square foot. 801 Blueberry Ct is a home located in Leavenworth County with nearby schools including Lansing Elementary School, Lansing Middle 6-8, and Lansing High 9-12.
Ownership History
Date
Name
Owned For
Owner Type
Purchase Details
Closed on
May 8, 2025
Sold by
Scott David P and Scott Suellen Joyce
Bought by
David & Suellen Scott Living Trust and Scott
Current Estimated Value
Purchase Details
Closed on
Mar 1, 2004
Bought by
David Scott P and David Suellen Scott
Home Financials for this Owner
Home Financials are based on the most recent Mortgage that was taken out on this home.
Original Mortgage
$50,000
Interest Rate
5.58%
Mortgage Type
New Conventional
Create a Home Valuation Report for This Property
The Home Valuation Report is an in-depth analysis detailing your home's value as well as a comparison with similar homes in the area
Home Values in the Area
Average Home Value in this Area
Purchase History
| Date | Buyer | Sale Price | Title Company |
|---|---|---|---|
| David & Suellen Scott Living Trust | -- | None Listed On Document | |
| David Scott P | $255,900 | -- |
Source: Public Records
Mortgage History
| Date | Status | Borrower | Loan Amount |
|---|---|---|---|
| Previous Owner | David Scott P | $50,000 |
Source: Public Records
Tax History Compared to Growth
Tax History
| Year | Tax Paid | Tax Assessment Tax Assessment Total Assessment is a certain percentage of the fair market value that is determined by local assessors to be the total taxable value of land and additions on the property. | Land | Improvement |
|---|---|---|---|---|
| 2025 | $6,038 | $45,551 | $5,153 | $40,398 |
| 2024 | $5,819 | $44,631 | $5,153 | $39,478 |
| 2023 | $5,819 | $44,631 | $5,153 | $39,478 |
| 2022 | $5,589 | $40,527 | $5,438 | $35,089 |
| 2021 | $5,195 | $36,018 | $5,438 | $30,580 |
| 2020 | $4,857 | $33,154 | $5,438 | $27,716 |
| 2019 | $4,864 | $33,154 | $5,438 | $27,716 |
| 2018 | $4,757 | $32,447 | $5,438 | $27,009 |
| 2017 | $4,464 | $30,396 | $5,438 | $24,958 |
| 2016 | $4,421 | $30,095 | $5,438 | $24,657 |
| 2015 | $4,543 | $31,004 | $5,438 | $25,566 |
| 2014 | $4,325 | $30,141 | $5,438 | $24,703 |
Source: Public Records
Map
Nearby Homes
- 722 Bittersweet Rd
- 624 S Bittersweet Ln
- 922 Southfork St
- 527 S Valley Dr
- 901 S Main St
- 811 4-H Rd
- 115 W Gilman Rd
- 104 Olive St
- 506 1st Terrace
- 000 4-H Rd
- 131 Rock Creek Loop
- 202 S Main St
- 124 S Main St
- 875 Clearview Dr
- 102 S 3rd Ct
- 1221 S Desoto Rd
- 705 Rock Creek Dr
- 833 Rock Creek Dr
- 209 E Kay St
- 218 E Kay St