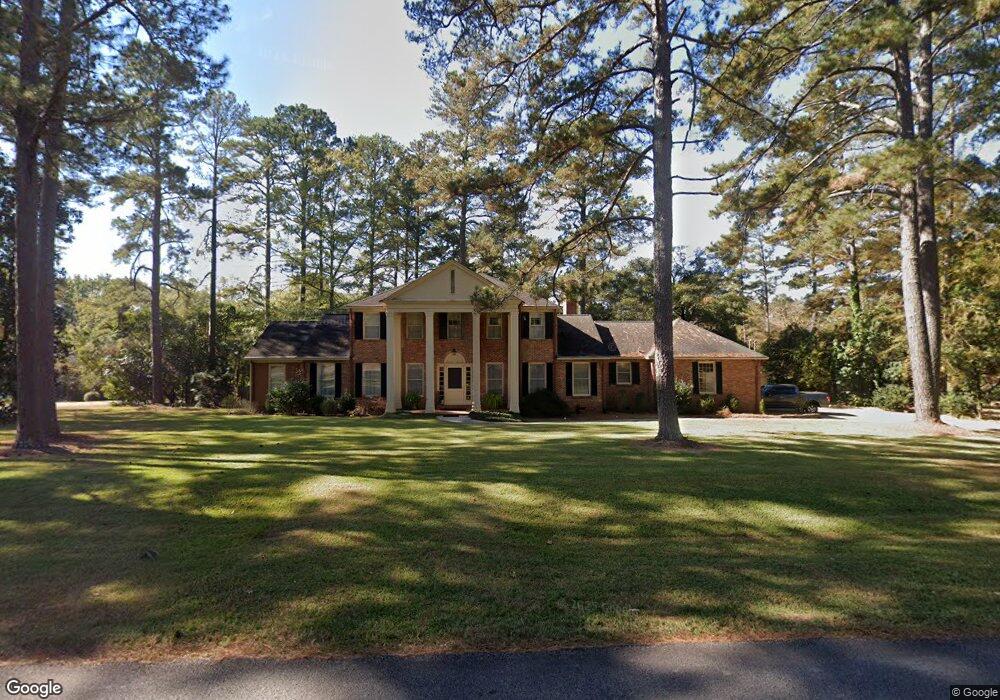
801 Cherokee Rd Lagrange, GA 30240
Estimated Value: $426,000 - $506,000
5
Beds
3
Baths
3,428
Sq Ft
$134/Sq Ft
Est. Value
About This Home
This home is located at 801 Cherokee Rd, Lagrange, GA 30240 and is currently estimated at $457,733, approximately $133 per square foot. 801 Cherokee Rd is a home located in Troup County with nearby schools including Hollis Hand Elementary School, Franklin Forest Elementary School, and Ethel W. Kight Elementary School.
Ownership History
Date
Name
Owned For
Owner Type
Purchase Details
Closed on
Apr 20, 2006
Sold by
Pennebaker Shirley M
Bought by
Pennebaker Shirley and Pennebaker Jim
Current Estimated Value
Purchase Details
Closed on
May 6, 2003
Sold by
Cyphers
Bought by
Shirley M Pennebaker
Purchase Details
Closed on
Nov 29, 1993
Sold by
Carol A Roth
Bought by
Cyphers
Purchase Details
Closed on
Mar 5, 1991
Sold by
Arthur Roth
Bought by
Carol A Roth
Purchase Details
Closed on
Jul 15, 1988
Sold by
Mrs Sookyong Choi
Bought by
Arthur Roth
Purchase Details
Closed on
Jan 1, 1974
Sold by
Dr Ivory Suit
Bought by
Mrs Sookyong Choi
Purchase Details
Closed on
Jan 1, 1957
Sold by
Bert W Culpepper
Bought by
Dr Ivory Suit
Create a Home Valuation Report for This Property
The Home Valuation Report is an in-depth analysis detailing your home's value as well as a comparison with similar homes in the area
Purchase History
| Date | Buyer | Sale Price | Title Company |
|---|---|---|---|
| Pennebaker Shirley | -- | -- | |
| Shirley M Pennebaker | -- | -- | |
| Cyphers | $199,000 | -- | |
| Carol A Roth | -- | -- | |
| Arthur Roth | $116,400 | -- | |
| Mrs Sookyong Choi | $79,000 | -- | |
| Dr Ivory Suit | -- | -- |
Source: Public Records
Tax History
| Year | Tax Paid | Tax Assessment Tax Assessment Total Assessment is a certain percentage of the fair market value that is determined by local assessors to be the total taxable value of land and additions on the property. | Land | Improvement |
|---|---|---|---|---|
| 2025 | $4,725 | $188,920 | $18,000 | $170,920 |
| 2024 | $4,050 | $150,480 | $18,000 | $132,480 |
| 2023 | $3,858 | $143,440 | $18,000 | $125,440 |
| 2022 | $3,696 | $134,400 | $18,000 | $116,400 |
| 2021 | $3,680 | $124,000 | $18,000 | $106,000 |
| 2020 | $3,680 | $124,000 | $18,000 | $106,000 |
| 2019 | $3,180 | $107,440 | $15,120 | $92,320 |
| 2018 | $3,048 | $103,040 | $15,120 | $87,920 |
| 2017 | $2,895 | $97,960 | $15,120 | $82,840 |
| 2016 | $2,857 | $96,722 | $15,120 | $81,602 |
| 2015 | $2,999 | $101,258 | $19,656 | $81,602 |
| 2014 | $2,953 | $99,575 | $19,656 | $79,919 |
| 2013 | -- | $74,078 | $11,068 | $63,010 |
Source: Public Records
Map
Nearby Homes
- 910 Piney Woods Dr
- 705 Piney Woods Dr
- 216 E Lane Cir
- 120 Saynor Cir
- 724 Camellia Dr
- 105 Saynor Cir
- 222 Beechwood Cir
- 203 Waverly Way
- 106 Ewing St
- 732 Camellia Dr
- 598 Edmondson Ave
- 203 S Chilton Crescent
- 201 S Chilton Crescent
- 0 Hills and Dales Farm Rd
- 109 Thomas St
- 219 Banks St
- 900 North St
- 110 Russell St
- 0 Ridley Ave Unit 10550104
- 609 Ridley Ave
- 712 Larose Terrace
- 800 Cherokee Rd
- 718 Larose Terrace
- 707 Larose Terrace
- 772 Cherokee Rd
- 703 Larose Terrace
- 711 Larose Terrace
- 813 Cherokee Rd
- 717 Larose Terrace
- 766 Cherokee Rd
- 724 Larose Terrace
- 759 Cherokee Rd
- 829 Piney Woods Dr
- 808 Cherokee Rd
- 827 Piney Woods Dr
- 760 Cherokee Rd
- 723 Larose Terrace
- 526 Ridgecrest Rd
- 823 Piney Woods Dr
- 528 Ridgecrest Rd
Your Personal Tour Guide
Ask me questions while you tour the home.