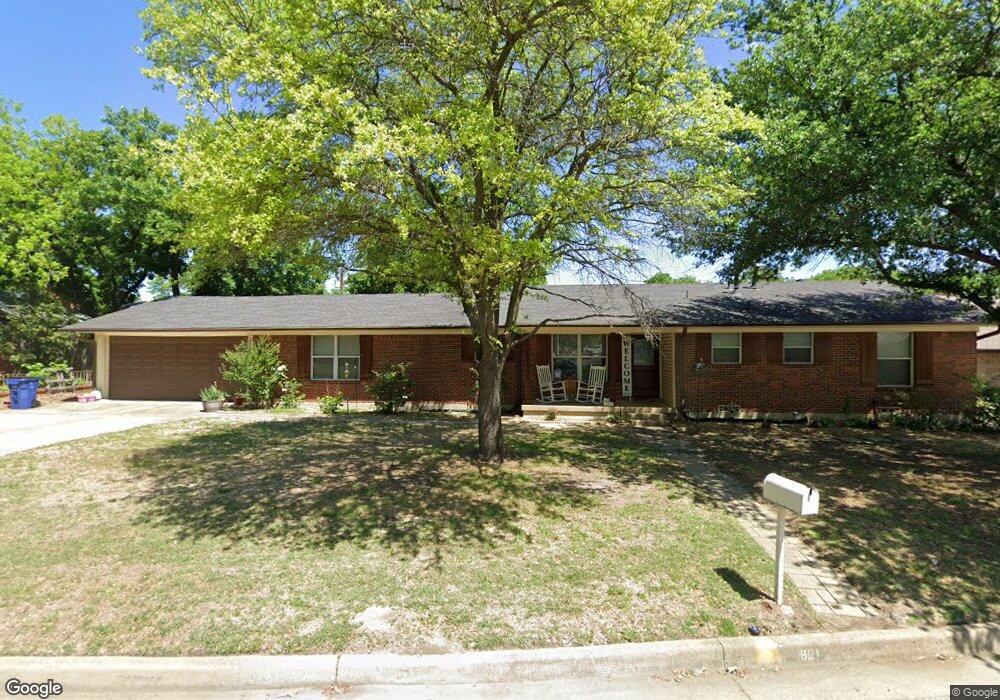
801 Cherry St Sanger, TX 76266
Estimated Value: $353,505 - $395,000
4
Beds
3
Baths
2,500
Sq Ft
$149/Sq Ft
Est. Value
About This Home
This home is located at 801 Cherry St, Sanger, TX 76266 and is currently estimated at $373,376, approximately $149 per square foot. 801 Cherry St is a home located in Denton County with nearby schools including Chisholm Trail Elementary School, Clear Creek Intermediate School, and Sanger Sixth Grade Campus.
Ownership History
Date
Name
Owned For
Owner Type
Purchase Details
Closed on
Mar 26, 2020
Sold by
Payne John and Payne Dawn
Bought by
Waggoner James E and Waggoner Susan B
Current Estimated Value
Home Financials for this Owner
Home Financials are based on the most recent Mortgage that was taken out on this home.
Original Mortgage
$182,400
Outstanding Balance
$160,881
Interest Rate
3.4%
Mortgage Type
New Conventional
Estimated Equity
$212,495
Purchase Details
Closed on
Dec 6, 2011
Sold by
Thornbury Custom Homes Inc
Bought by
Affiliated Bank
Purchase Details
Closed on
Oct 20, 2011
Sold by
Intel Corporation
Bought by
Quicksilver Resources Inc
Purchase Details
Closed on
Sep 1, 2011
Sold by
Haddock Vera F
Bought by
Quicksilver Resources Inc
Purchase Details
Closed on
Apr 13, 2011
Sold by
Cowtown Pipeline L P
Bought by
Cowtown Pipeline Partners L P
Purchase Details
Closed on
Apr 1, 2011
Sold by
Ragsdale Nolin
Bought by
Quicksilver Resources Inc
Purchase Details
Closed on
Jun 16, 2009
Sold by
Lmi I New Lp
Bought by
Southwest Securities Fsb
Purchase Details
Closed on
Aug 12, 2008
Sold by
Engelage Craig D and Chirico William M
Bought by
Southwest Securities Fsb
Purchase Details
Closed on
Sep 18, 2006
Sold by
Anthony Donald B
Bought by
Johndroe S G
Purchase Details
Closed on
Sep 5, 2006
Sold by
Guy James Phase Ii Lp
Bought by
Southwest Securities Fsb
Purchase Details
Closed on
May 11, 2004
Sold by
Powell Elmer C and Powell Elmer C
Bought by
Oncor Electric Delivery Co
Purchase Details
Closed on
Aug 3, 2001
Sold by
Marshall Lester and Sprague Delbert
Bought by
Payne John and Payne Dawn
Home Financials for this Owner
Home Financials are based on the most recent Mortgage that was taken out on this home.
Original Mortgage
$111,000
Interest Rate
7.07%
Mortgage Type
Seller Take Back
Create a Home Valuation Report for This Property
The Home Valuation Report is an in-depth analysis detailing your home's value as well as a comparison with similar homes in the area
Home Values in the Area
Average Home Value in this Area
Purchase History
| Date | Buyer | Sale Price | Title Company |
|---|---|---|---|
| Waggoner James E | -- | None Available | |
| Affiliated Bank | $235,000 | None Available | |
| Affiliated Bank | $1,643,000 | None Available | |
| Quicksilver Resources Inc | -- | Rattikin Title Company | |
| Quicksilver Resources Inc | -- | Rtt | |
| Cowtown Pipeline Partners L P | -- | None Available | |
| Quicksilver Resources Inc | -- | Porter Abstract & Title | |
| Southwest Securities Fsb | $6,000,000 | None Available | |
| Southwest Securities Fsb | $427,000 | None Available | |
| Johndroe S G | -- | Title Resources | |
| Southwest Securities Fsb | $598,500 | None Available | |
| Oncor Electric Delivery Co | -- | Commonwealth Title | |
| Payne John | -- | -- | |
| Payne John | -- | -- |
Source: Public Records
Mortgage History
| Date | Status | Borrower | Loan Amount |
|---|---|---|---|
| Open | Waggoner James E | $182,400 | |
| Previous Owner | Payne John | $111,000 |
Source: Public Records
Tax History
| Year | Tax Paid | Tax Assessment Tax Assessment Total Assessment is a certain percentage of the fair market value that is determined by local assessors to be the total taxable value of land and additions on the property. | Land | Improvement |
|---|---|---|---|---|
| 2025 | $7,429 | $354,590 | $72,000 | $282,590 |
| 2024 | $7,429 | $367,597 | $72,000 | $295,597 |
| 2023 | $6,832 | $337,096 | $56,000 | $281,096 |
| 2022 | $7,400 | $333,670 | $49,500 | $284,170 |
| 2021 | $6,733 | $320,363 | $40,500 | $279,863 |
| 2020 | $3,450 | $155,897 | $40,500 | $127,502 |
| 2019 | $3,227 | $141,725 | $40,500 | $114,500 |
| 2018 | $2,949 | $128,841 | $40,500 | $96,683 |
| 2017 | $2,694 | $117,128 | $40,500 | $87,433 |
| 2016 | $2,449 | $106,480 | $22,500 | $83,980 |
| 2015 | $1,995 | $97,096 | $22,500 | $74,596 |
| 2013 | -- | $124,416 | $22,500 | $101,916 |
Source: Public Records
Map
Nearby Homes
- 710 W Willow St
- 412 N 10th St
- 500 W Willow St
- 1209 Bolivar St
- 411 Hughes St
- TBD Church St
- Tbd Church St
- 612 N 10th St
- 4551 Farm To Market Road 455
- 2164 Farm To Market Road 455
- 4063 Farm To Market 455 W
- 403 S 1st St
- 1149 Serendipity Cir
- 113 Diane Dr
- 307 Railroad Ave
- 309 Railroad Ave
- 117 Kathryn Dr
- 102 E Willow St
- Tbd I-35
- 701 Keaton Rd S Unit S
Your Personal Tour Guide
Ask me questions while you tour the home.