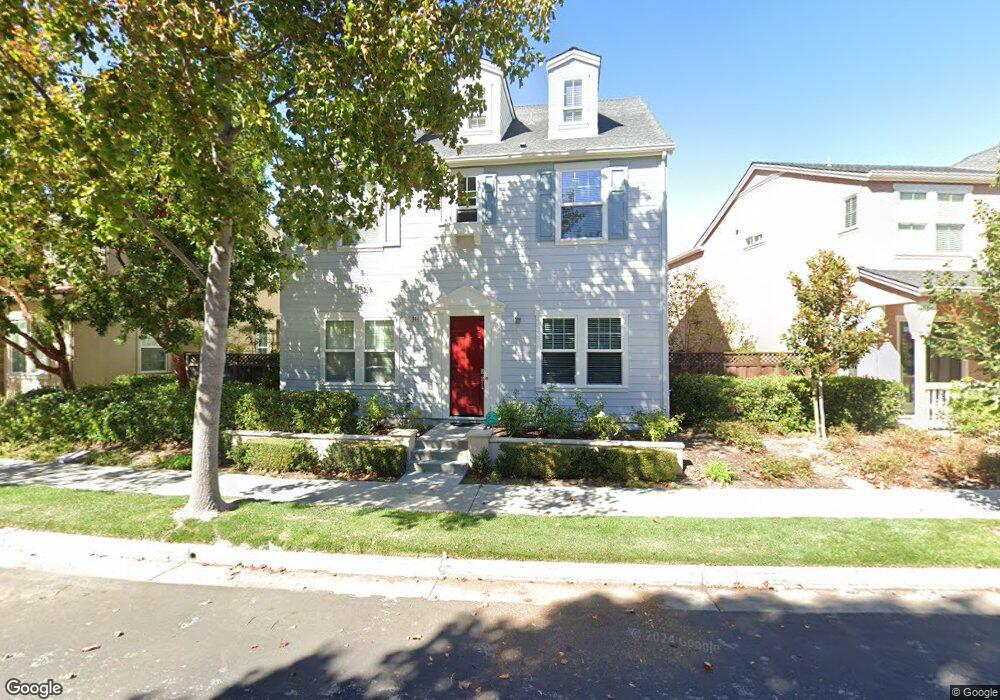
801 E River Pkwy Santa Clara, CA 95054
North Santa Clara NeighborhoodEstimated Value: $2,615,873 - $3,319,000
5
Beds
4
Baths
3,113
Sq Ft
$940/Sq Ft
Est. Value
About This Home
This home is located at 801 E River Pkwy, Santa Clara, CA 95054 and is currently estimated at $2,924,718, approximately $939 per square foot. 801 E River Pkwy is a home located in Santa Clara County with nearby schools including Don Callejon School, Santa Clara High School, and North Valley Baptist School.
Ownership History
Date
Name
Owned For
Owner Type
Purchase Details
Closed on
Apr 2, 2015
Sold by
Shinnerl Joseph R and Hansen Clare T
Bought by
The Hansen Shinnerl Family 2011 Revocabl and Hansen Shinnerl Clare T
Current Estimated Value
Home Financials for this Owner
Home Financials are based on the most recent Mortgage that was taken out on this home.
Original Mortgage
$1,012,000
Outstanding Balance
$779,622
Interest Rate
3.76%
Mortgage Type
New Conventional
Estimated Equity
$2,145,096
Purchase Details
Closed on
Apr 14, 2011
Sold by
Shinnerl Joseph R and Hansen Clare T
Bought by
Shinnerl Joseph R and Hansen Clare T
Purchase Details
Closed on
Aug 20, 2008
Sold by
Andersen Tyler
Bought by
Shinnerl Joseph R and Shinnerl Clare Hansen
Home Financials for this Owner
Home Financials are based on the most recent Mortgage that was taken out on this home.
Original Mortgage
$133,000
Interest Rate
6.37%
Mortgage Type
Stand Alone Second
Purchase Details
Closed on
Dec 29, 2004
Sold by
Greystone Homes Inc
Bought by
Andersen Tyler
Create a Home Valuation Report for This Property
The Home Valuation Report is an in-depth analysis detailing your home's value as well as a comparison with similar homes in the area
Home Values in the Area
Average Home Value in this Area
Purchase History
| Date | Buyer | Sale Price | Title Company |
|---|---|---|---|
| The Hansen Shinnerl Family 2011 Revocabl | -- | First American Title Company | |
| Shinnerl Joseph R | -- | None Available | |
| Shinnerl Joseph R | $1,330,000 | First American Title Co | |
| Andersen Tyler | $1,009,500 | North American Title Company |
Source: Public Records
Mortgage History
| Date | Status | Borrower | Loan Amount |
|---|---|---|---|
| Open | The Hansen Shinnerl Family 2011 Revocabl | $1,012,000 | |
| Closed | Shinnerl Joseph R | $133,000 | |
| Closed | Shinnerl Joseph R | $1,064,000 |
Source: Public Records
Tax History Compared to Growth
Tax History
| Year | Tax Paid | Tax Assessment Tax Assessment Total Assessment is a certain percentage of the fair market value that is determined by local assessors to be the total taxable value of land and additions on the property. | Land | Improvement |
|---|---|---|---|---|
| 2025 | $19,643 | $1,712,714 | $643,876 | $1,068,838 |
| 2024 | $19,643 | $1,679,132 | $631,251 | $1,047,881 |
| 2023 | $19,365 | $1,646,209 | $618,874 | $1,027,335 |
| 2022 | $19,042 | $1,613,932 | $606,740 | $1,007,192 |
| 2021 | $18,968 | $1,582,288 | $594,844 | $987,444 |
| 2020 | $18,623 | $1,566,064 | $588,745 | $977,319 |
| 2019 | $18,598 | $1,535,357 | $577,201 | $958,156 |
| 2018 | $17,396 | $1,505,253 | $565,884 | $939,369 |
| 2017 | $17,311 | $1,475,739 | $554,789 | $920,950 |
| 2016 | $16,881 | $1,446,804 | $543,911 | $902,893 |
| 2015 | $16,816 | $1,425,072 | $535,741 | $889,331 |
| 2014 | $15,995 | $1,397,158 | $525,247 | $871,911 |
Source: Public Records
Map
Nearby Homes
- 4226 Tobin Cir
- 1220 Kelley Way
- 3901 Lick Mill Blvd Unit 230
- 3901 Lick Mill Blvd Unit 458
- 1898 Garzoni Place
- 1901 Garzoni Place Unit 405
- 1883 Agnew Rd Unit 341
- 1883 Agnew Rd Unit 367
- 920 Clyde Ave
- 4636 Armour Dr
- 930 Clyde Ave
- 4288 Macedo Place
- 1031 Clyde Ave Unit 1802
- 4699 Snead Dr
- 4503 Cheeney St
- 4676 Wilcox Ave
- 1900 Chestnut St
- 2183 Hunter Place
- 2243 Creek Bed Ct
- 2200 Agnew Rd Unit 212
- 805 E River Pkwy
- 795 E River Pkwy
- 819 E River Pkwy
- 4292 Burdick Ln
- 4302 Burdick Ln
- 827 E River Pkwy
- 4310 Burdick Ln
- 802 E River Pkwy
- 800 E River Pkwy
- 804 E River Pkwy
- 796 E River Pkwy
- 806 E River Pkwy
- 4320 Burdick Ln
- 835 E River Pkwy
- 4290 Watson Cir
- 792 E River Pkwy
- 816 E River Pkwy
- 783 E River Pkwy
- 4324 Watson Cir
- 781 E River Pkwy