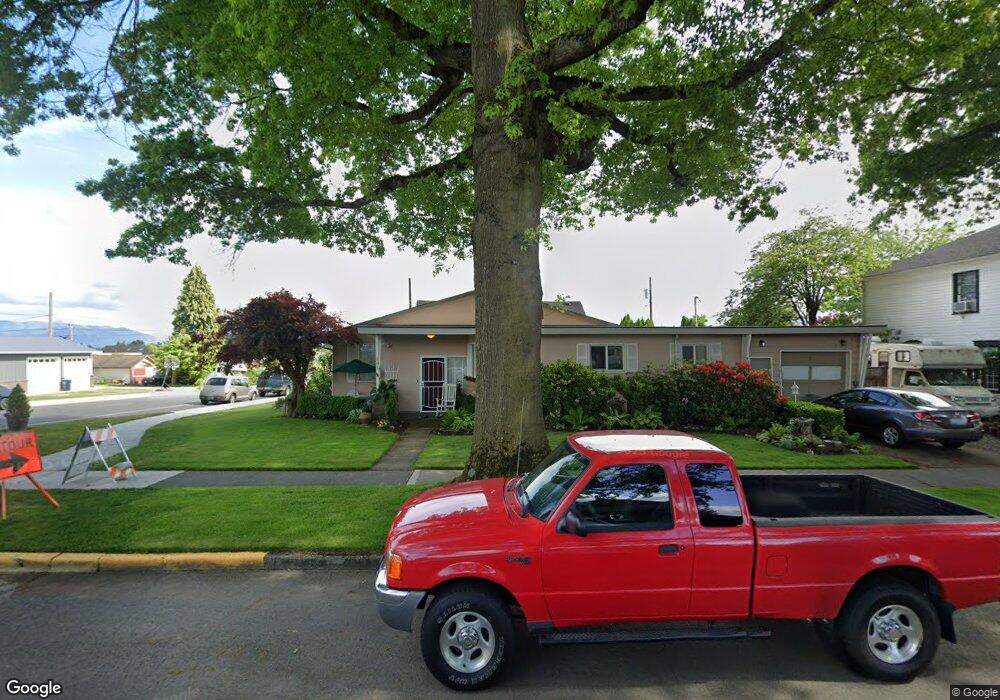
801 Front St Lynden, WA 98264
Estimated Value: $490,000 - $632,000
2
Beds
2
Baths
1,689
Sq Ft
$325/Sq Ft
Est. Value
About This Home
This home is located at 801 Front St, Lynden, WA 98264 and is currently estimated at $548,762, approximately $324 per square foot. 801 Front St is a home located in Whatcom County with nearby schools including Lynden High School, Lynden Christian School, and Lynden Christian Schools: Administration.
Ownership History
Date
Name
Owned For
Owner Type
Purchase Details
Closed on
Apr 30, 2010
Sold by
French Michael L
Bought by
Vos Jamie J and Vos Rachel M
Current Estimated Value
Home Financials for this Owner
Home Financials are based on the most recent Mortgage that was taken out on this home.
Original Mortgage
$190,000
Outstanding Balance
$127,225
Interest Rate
5.03%
Mortgage Type
Seller Take Back
Estimated Equity
$421,537
Purchase Details
Closed on
Nov 2, 2004
Sold by
Reinsma William and Reinsma Karen
Bought by
French Roger A and French Marilyn L
Home Financials for this Owner
Home Financials are based on the most recent Mortgage that was taken out on this home.
Original Mortgage
$72,000
Interest Rate
5.69%
Mortgage Type
Purchase Money Mortgage
Purchase Details
Closed on
Aug 29, 2003
Sold by
Bierlink Rodney B and Bierlink Lana J
Bought by
Reinsma William and Reinsma Karen
Create a Home Valuation Report for This Property
The Home Valuation Report is an in-depth analysis detailing your home's value as well as a comparison with similar homes in the area
Home Values in the Area
Average Home Value in this Area
Purchase History
| Date | Buyer | Sale Price | Title Company |
|---|---|---|---|
| Vos Jamie J | $190,280 | None Available | |
| French Roger A | $194,000 | Chicago Title Insurance | |
| Reinsma William | -- | Chicago Title Insurance |
Source: Public Records
Mortgage History
| Date | Status | Borrower | Loan Amount |
|---|---|---|---|
| Open | Vos Jamie J | $190,000 | |
| Previous Owner | French Roger A | $72,000 |
Source: Public Records
Tax History Compared to Growth
Tax History
| Year | Tax Paid | Tax Assessment Tax Assessment Total Assessment is a certain percentage of the fair market value that is determined by local assessors to be the total taxable value of land and additions on the property. | Land | Improvement |
|---|---|---|---|---|
| 2024 | $3,401 | $475,889 | $218,250 | $257,639 |
| 2023 | $3,401 | $472,730 | $225,000 | $247,730 |
| 2022 | $2,860 | $375,073 | $135,383 | $239,690 |
| 2021 | $2,806 | $309,974 | $111,885 | $198,089 |
| 2020 | $2,459 | $276,770 | $99,900 | $176,870 |
| 2019 | $2,187 | $253,855 | $91,725 | $162,130 |
| 2018 | $2,390 | $231,494 | $83,558 | $147,936 |
| 2017 | $2,149 | $207,785 | $75,000 | $132,785 |
| 2016 | $2,031 | $198,614 | $68,200 | $130,414 |
| 2015 | $1,801 | $186,708 | $65,596 | $121,112 |
| 2014 | -- | $180,380 | $63,364 | $117,016 |
| 2013 | -- | $179,016 | $62,000 | $117,016 |
Source: Public Records
Map
Nearby Homes
- 706 Judson St Unit B
- 706 Judson St Unit A
- 915 Front St
- 0 Guide Meridian Unit NWM2369980
- 908 Liberty St
- 410 10th St
- 1218 Front St
- 518 Edson St
- 104 Riverwalk Dr
- 206 Pebblebrook Dr
- 204 Pebblebrook Dr
- 102 Riverwalk Dr
- 207 Pebblebrook Dr
- 205 Pebblebrook Dr
- 211 Pebblebrook Dr
- 208 Riverwalk Dr
- 205 Riverwalk Dr
- 202 Skipping Stone Loop
- 204 Skipping Stone Loop
- 231 Skipping Stone Loop