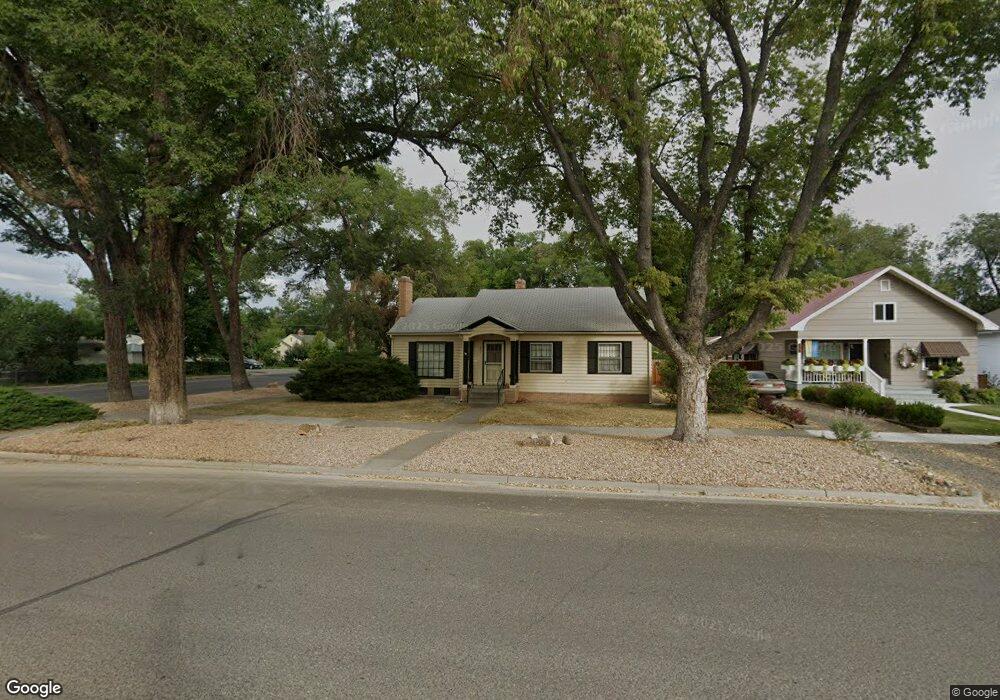
801 N 1st St Montrose, CO 81401
Estimated Value: $410,000 - $465,000
3
Beds
2
Baths
2,025
Sq Ft
$211/Sq Ft
Est. Value
About This Home
This home is located at 801 N 1st St, Montrose, CO 81401 and is currently estimated at $427,557, approximately $211 per square foot. 801 N 1st St is a home located in Montrose County with nearby schools including Northside Elementary School, Centennial Middle School, and Montrose High School.
Ownership History
Date
Name
Owned For
Owner Type
Purchase Details
Closed on
Aug 31, 2023
Sold by
Dmb Llc
Bought by
Kidnay Brian A and Kidnay Joan
Current Estimated Value
Purchase Details
Closed on
Aug 29, 2023
Sold by
Kidnay Joan
Bought by
Kidnay Brian
Purchase Details
Closed on
Dec 19, 2008
Sold by
Kidnay Brian A
Bought by
Dmb Llc
Purchase Details
Closed on
Dec 1, 2008
Sold by
Beauregard Angelique and Pope Angelique Beauregard
Bought by
Kidnay Brian A
Purchase Details
Closed on
Sep 12, 2001
Sold by
Beauregard Betty
Bought by
Beauregard Angelique
Purchase Details
Closed on
Oct 26, 1999
Sold by
Radcliff Shane M
Bought by
Beauregard Betty
Purchase Details
Closed on
Feb 10, 1994
Sold by
Slaker David A and Slaker Gloria J
Bought by
Radcliff Shane M
Purchase Details
Closed on
May 25, 1979
Sold by
Ward Edwin I and Ward Lavange
Bought by
Slaker David A and Slaker Gloria J
Create a Home Valuation Report for This Property
The Home Valuation Report is an in-depth analysis detailing your home's value as well as a comparison with similar homes in the area
Home Values in the Area
Average Home Value in this Area
Purchase History
| Date | Buyer | Sale Price | Title Company |
|---|---|---|---|
| Kidnay Brian A | -- | None Listed On Document | |
| Kidnay Brian | $337,500 | None Listed On Document | |
| Dmb Llc | -- | None Available | |
| Kidnay Brian A | $185,000 | Land Title Guarantee Company | |
| Beauregard Angelique | -- | -- | |
| Beauregard Betty | $143,500 | -- | |
| Radcliff Shane M | $113,000 | -- | |
| Slaker David A | $48,800 | -- |
Source: Public Records
Tax History Compared to Growth
Tax History
| Year | Tax Paid | Tax Assessment Tax Assessment Total Assessment is a certain percentage of the fair market value that is determined by local assessors to be the total taxable value of land and additions on the property. | Land | Improvement |
|---|---|---|---|---|
| 2024 | $1,849 | $25,970 | $3,710 | $22,260 |
| 2023 | $1,849 | $30,770 | $4,400 | $26,370 |
| 2022 | $1,396 | $20,290 | $3,200 | $17,090 |
| 2021 | $1,439 | $20,870 | $3,290 | $17,580 |
| 2020 | $1,161 | $17,300 | $2,840 | $14,460 |
| 2019 | $1,168 | $17,300 | $2,840 | $14,460 |
| 2018 | $997 | $14,400 | $2,290 | $12,110 |
| 2017 | $989 | $14,400 | $2,290 | $12,110 |
| 2016 | $979 | $14,490 | $2,310 | $12,180 |
| 2015 | $961 | $14,490 | $2,310 | $12,180 |
| 2014 | $841 | $13,570 | $2,310 | $11,260 |
Source: Public Records
Map
Nearby Homes
- 1037 N 1st St
- 701 N 4th St
- 218 N Stough Ave
- 512 N 5th St
- 338 N Stough Ave
- TBD S 4th St
- 700 N Nevada Ave
- TBD N Cedar
- 638 N Cascade Ave
- 147 E Main St Unit 147 Main , 18 N Se
- 806 N Park Ave
- 612 & 616 S 6th
- 505 Miami Rd
- 814 S 7th St
- 1201 N San Juan Ave
- 383 S Hillcrest Dr Unit 62
- 383 S Hillcrest Dr Unit 30
- 23 S 5th St
- 902 S Mesa Ave
- 909 S 10th St
- 811 N 1st St
- 821 N 1st St
- 136 N Nevada Ave
- N N 1st St Unit 405 N 1st Street
- N N 1st St Unit G (Downstairs)
- N N 1st St Unit F (Downstairs)
- N N 1st St Unit D (Downstairs)
- N N 1st St Unit E (Downstairs)
- N N 1st St Unit C (Downstairs)
- N N 1st St Unit A & B (Top Floor)
- N N 1st St
- 747 N 1st St
- 816 N 2nd St
- 839 N 1st St
- 38 N Nevada Ave
- 828 N 2nd St
- 737 N 1st St
- 137 N Nevada Ave
- 847 N 1st St
- 826 N 1st St