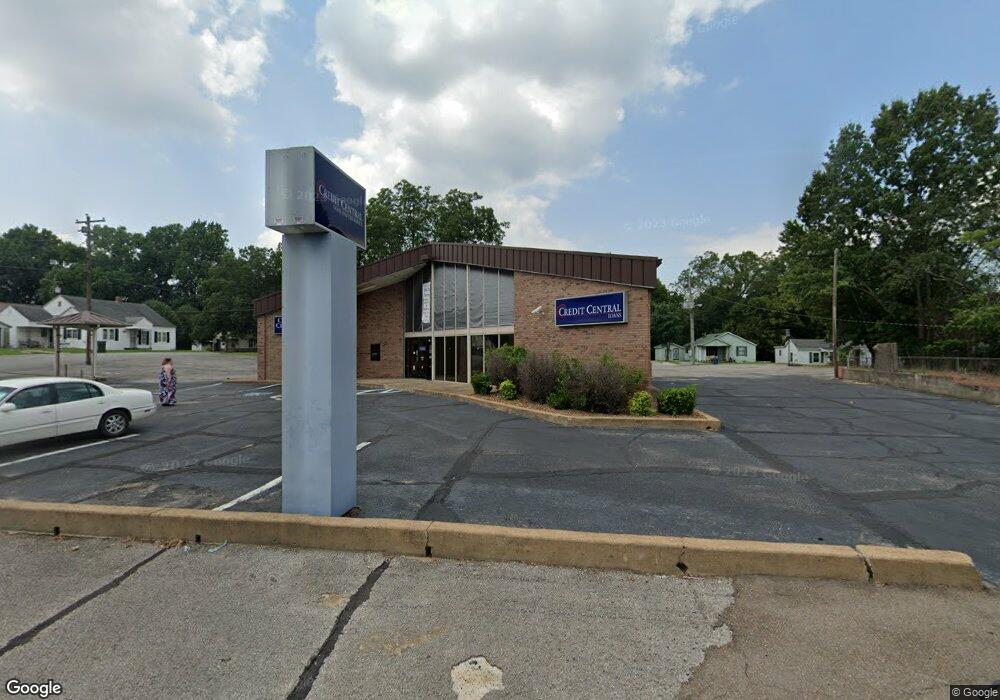
801 N 22nd Ave Humboldt, TN 38343
Estimated Value: $249,536
--
Bed
--
Bath
3,445
Sq Ft
$72/Sq Ft
Est. Value
About This Home
This home is located at 801 N 22nd Ave, Humboldt, TN 38343 and is currently estimated at $249,536, approximately $72 per square foot. 801 N 22nd Ave is a home located in Gibson County with nearby schools including Stigall Primary School, East Elementary School, and Humboldt Middle School.
Ownership History
Date
Name
Owned For
Owner Type
Purchase Details
Closed on
May 25, 2018
Sold by
Lone Oak Holdings Llc
Bought by
Terry Randy and Terry Lisa M
Current Estimated Value
Purchase Details
Closed on
Sep 5, 2013
Sold by
Cb & S Bank
Bought by
Lone Oak Holdings Llc
Home Financials for this Owner
Home Financials are based on the most recent Mortgage that was taken out on this home.
Original Mortgage
$60,000
Interest Rate
4.39%
Mortgage Type
Commercial
Purchase Details
Closed on
Aug 29, 2013
Sold by
Regions Bank
Bought by
Citizens Bank And Savings Co
Home Financials for this Owner
Home Financials are based on the most recent Mortgage that was taken out on this home.
Original Mortgage
$60,000
Interest Rate
4.39%
Mortgage Type
Commercial
Purchase Details
Closed on
Aug 30, 2007
Sold by
Union Planters Ntl Bank
Bought by
Citizens Bank & Savings
Purchase Details
Closed on
Jan 4, 1900
Bought by
Merchants State Bank
Purchase Details
Closed on
Jan 3, 1900
Purchase Details
Closed on
Jan 2, 1900
Create a Home Valuation Report for This Property
The Home Valuation Report is an in-depth analysis detailing your home's value as well as a comparison with similar homes in the area
Home Values in the Area
Average Home Value in this Area
Purchase History
| Date | Buyer | Sale Price | Title Company |
|---|---|---|---|
| Terry Randy | $135,000 | -- | |
| Lone Oak Holdings Llc | $50,000 | -- | |
| Citizens Bank And Savings Co | -- | -- | |
| Citizens Bank & Savings | -- | -- | |
| Merchants State Bank | -- | -- | |
| -- | -- | -- | |
| -- | -- | -- |
Source: Public Records
Mortgage History
| Date | Status | Borrower | Loan Amount |
|---|---|---|---|
| Previous Owner | Lone Oak Holdings Llc | $60,000 | |
| Previous Owner | Citizens Bank And Savings Co | $60,000 |
Source: Public Records
Tax History Compared to Growth
Tax History
| Year | Tax Paid | Tax Assessment Tax Assessment Total Assessment is a certain percentage of the fair market value that is determined by local assessors to be the total taxable value of land and additions on the property. | Land | Improvement |
|---|---|---|---|---|
| 2025 | $2,162 | $79,760 | $0 | $0 |
| 2024 | $2,162 | $79,760 | $20,800 | $58,960 |
| 2023 | $557 | $50,520 | $19,000 | $31,520 |
| 2022 | $521 | $50,520 | $19,000 | $31,520 |
| 2021 | $521 | $50,520 | $19,000 | $31,520 |
| 2020 | $1,900 | $50,520 | $19,000 | $31,520 |
| 2019 | $1,900 | $50,520 | $19,000 | $31,520 |
| 2018 | $1,675 | $41,280 | $19,000 | $22,280 |
| 2017 | $1,655 | $41,280 | $19,000 | $22,280 |
| 2016 | $1,655 | $41,280 | $19,000 | $22,280 |
| 2015 | $1,640 | $41,280 | $19,000 | $22,280 |
| 2014 | -- | $45,360 | $19,000 | $26,360 |
Source: Public Records
Map
Nearby Homes
- 1907 E Mitchell St
- 0 +-6 Acres Gadsden Todd Levee Unit 241321
- 700 N 18th Ave
- 811 N 24th Ave
- 2425 St Mary Dr
- 2508 Vine St
- 2107 Campbell St
- 1635 Osborne St
- 1325 N 17th Ave
- 1509 Vine St
- 1416 N 18th Ave
- 1338 Dungan St
- 405 N 16th Ave
- 1438 N 19th Ave
- 112 S 17th Ave
- 171 N 28th Ave
- 2900 E Mitchell St
- 700 N 29th Ave
- 1211 N 29th Ave
- 0 Calhoun Etheridge & Rr Unit 246886