Estimated Value: $71,000 - $93,000
3
Beds
2
Baths
1,115
Sq Ft
$71/Sq Ft
Est. Value
About This Home
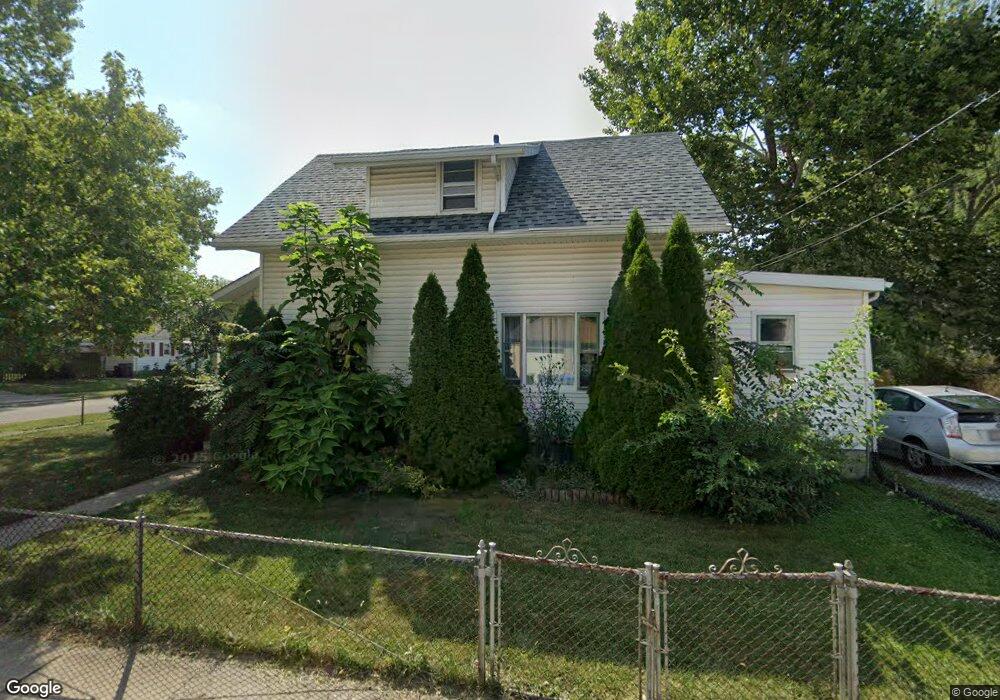
This home is located at 801 N Baxter St, Lima, OH 45801 and is currently estimated at $78,952, approximately $70 per square foot. 801 N Baxter St is a home located in Allen County with nearby schools including Independence Elementary School, Lima North Middle School, and Lima West Middle School.
Ownership History
Date
Name
Owned For
Owner Type
Purchase Details
Closed on
Oct 13, 2011
Sold by
Vision 3 Investments Llc
Bought by
Vision 2 Investments Llc
Current Estimated Value
Purchase Details
Closed on
Aug 22, 2011
Sold by
Secretary Of Housing & Urban Development
Bought by
Vision 3 Investments Llc
Purchase Details
Closed on
Mar 7, 2011
Sold by
Atkins Jerry W and Atkins Heather L
Bought by
Citimortgage Inc
Purchase Details
Closed on
Feb 21, 2011
Sold by
Citimortgage Inc
Bought by
The Secretary Of Housing & Urban Develop
Purchase Details
Closed on
Oct 6, 1999
Sold by
Casady Brett
Bought by
Atkins Jerry and Atkins Heather
Home Financials for this Owner
Home Financials are based on the most recent Mortgage that was taken out on this home.
Original Mortgage
$48,301
Interest Rate
7.83%
Mortgage Type
FHA
Purchase Details
Closed on
Jan 24, 1994
Sold by
Brinkman Leonard S
Bought by
Casady Brett A and Casady Tabatha J
Purchase Details
Closed on
Jun 28, 1985
Bought by
Brinkman Leonard S
Create a Home Valuation Report for This Property
The Home Valuation Report is an in-depth analysis detailing your home's value as well as a comparison with similar homes in the area
Home Values in the Area
Average Home Value in this Area
Purchase History
| Date | Buyer | Sale Price | Title Company |
|---|---|---|---|
| Vision 2 Investments Llc | -- | Attorney | |
| Vision 3 Investments Llc | $9,757 | Attorney | |
| Citimortgage Inc | $20,000 | Attorney | |
| The Secretary Of Housing & Urban Develop | -- | Attorney | |
| Atkins Jerry | $48,700 | -- | |
| Casady Brett A | $27,000 | -- | |
| Brinkman Leonard S | $20,200 | -- |
Source: Public Records
Mortgage History
| Date | Status | Borrower | Loan Amount |
|---|---|---|---|
| Previous Owner | Atkins Jerry | $48,301 |
Source: Public Records
Tax History Compared to Growth
Tax History
| Year | Tax Paid | Tax Assessment Tax Assessment Total Assessment is a certain percentage of the fair market value that is determined by local assessors to be the total taxable value of land and additions on the property. | Land | Improvement |
|---|---|---|---|---|
| 2024 | $641 | $16,390 | $2,770 | $13,620 |
| 2023 | $642 | $14,360 | $2,420 | $11,940 |
| 2022 | $644 | $14,360 | $2,420 | $11,940 |
| 2021 | $682 | $14,360 | $2,420 | $11,940 |
| 2020 | $642 | $11,910 | $2,140 | $9,770 |
| 2019 | $642 | $11,910 | $2,140 | $9,770 |
| 2018 | $639 | $11,910 | $2,140 | $9,770 |
| 2017 | $644 | $11,910 | $2,140 | $9,770 |
| 2016 | $653 | $11,910 | $2,140 | $9,770 |
| 2015 | $756 | $11,910 | $2,140 | $9,770 |
| 2014 | $756 | $13,790 | $2,240 | $11,550 |
| 2013 | $736 | $13,790 | $2,240 | $11,550 |
Source: Public Records
Map
Nearby Homes
- 631 Hazel Ave
- 638 Hazel Ave
- 648 Hazel Ave
- 708 N Metcalf St
- 576 Cortlandt Ave
- 612 N Metcalf St
- 618 Woodward Ave
- 676 Cortlandt Ave
- 745 Brice Ave
- 416 Hazel Ave
- 627 Brice Ave
- 1116 Belvidere Ave
- 434 N Washington St
- 1023 Leland Ave
- 606 N West St
- 325 N McDonel St
- 222 W Grand Ave
- 1120 Richie Ave
- 616 N Elizabeth St
- 849 Runyan Ave