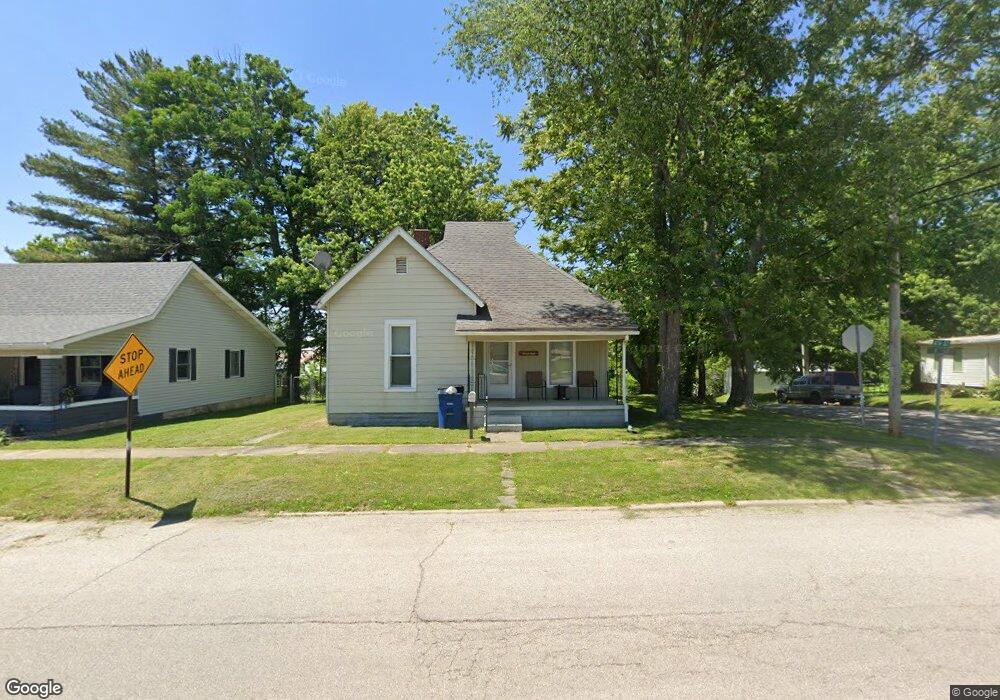
801 R St Bedford, IN 47421
Estimated Value: $136,000 - $187,000
2
Beds
1
Bath
1,078
Sq Ft
$142/Sq Ft
Est. Value
About This Home
This home is located at 801 R St, Bedford, IN 47421 and is currently estimated at $152,924, approximately $141 per square foot. 801 R St is a home located in Lawrence County with nearby schools including Bedford North Lawrence High School, St. Vincent de Paul School, and Stone City Christian Academy.
Ownership History
Date
Name
Owned For
Owner Type
Purchase Details
Closed on
Feb 24, 2020
Sold by
Whiteman Caleb J
Bought by
Whiteman Caleb J and Whiteman Hananh
Current Estimated Value
Home Financials for this Owner
Home Financials are based on the most recent Mortgage that was taken out on this home.
Original Mortgage
$45,600
Outstanding Balance
$40,398
Interest Rate
3.74%
Mortgage Type
New Conventional
Estimated Equity
$112,526
Purchase Details
Closed on
Jan 24, 2020
Sold by
Blackwell Scott D and Blackwell Kimberly B
Bought by
Whiteman Caleb J
Home Financials for this Owner
Home Financials are based on the most recent Mortgage that was taken out on this home.
Original Mortgage
$45,600
Outstanding Balance
$40,398
Interest Rate
3.74%
Mortgage Type
New Conventional
Estimated Equity
$112,526
Create a Home Valuation Report for This Property
The Home Valuation Report is an in-depth analysis detailing your home's value as well as a comparison with similar homes in the area
Home Values in the Area
Average Home Value in this Area
Purchase History
| Date | Buyer | Sale Price | Title Company |
|---|---|---|---|
| Whiteman Caleb J | -- | None Available | |
| Whiteman Caleb J | -- | None Available |
Source: Public Records
Mortgage History
| Date | Status | Borrower | Loan Amount |
|---|---|---|---|
| Open | Whiteman Caleb J | $45,600 |
Source: Public Records
Tax History Compared to Growth
Tax History
| Year | Tax Paid | Tax Assessment Tax Assessment Total Assessment is a certain percentage of the fair market value that is determined by local assessors to be the total taxable value of land and additions on the property. | Land | Improvement |
|---|---|---|---|---|
| 2024 | $423 | $58,100 | $10,000 | $48,100 |
| 2023 | $408 | $53,500 | $9,700 | $43,800 |
| 2022 | $315 | $50,400 | $9,400 | $41,000 |
| 2021 | $293 | $45,500 | $8,900 | $36,600 |
| 2020 | $266 | $43,000 | $8,500 | $34,500 |
| 2019 | $780 | $39,000 | $8,200 | $30,800 |
| 2018 | $764 | $38,200 | $8,000 | $30,200 |
| 2017 | $736 | $36,800 | $7,900 | $28,900 |
| 2016 | $730 | $36,500 | $7,900 | $28,600 |
| 2014 | $710 | $35,500 | $7,900 | $27,600 |
Source: Public Records
Map
Nearby Homes