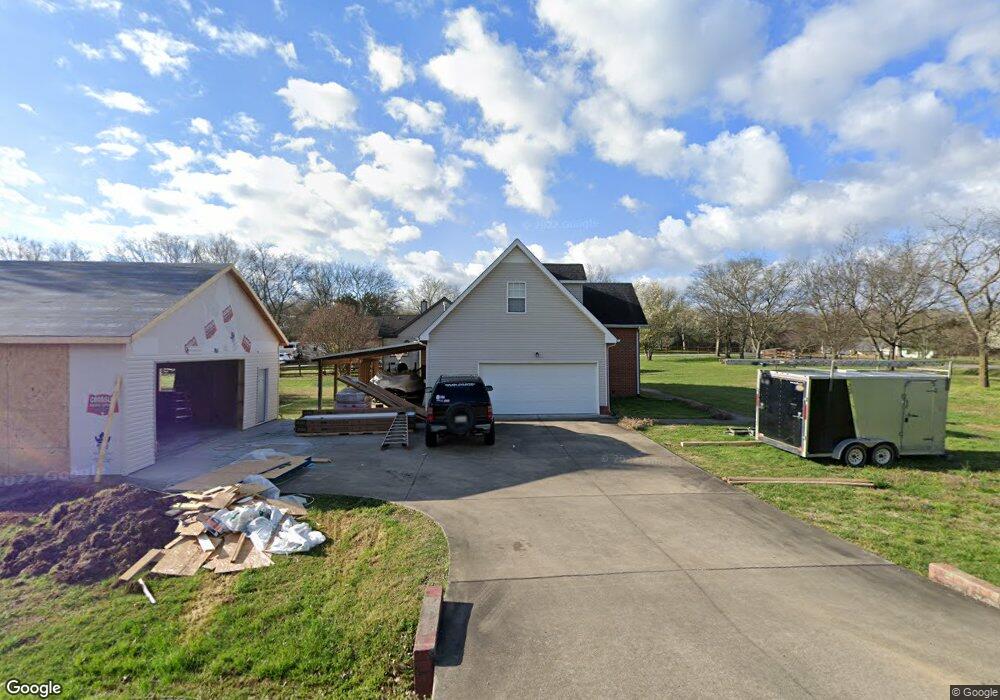
801 Rhett Dr Smyrna, TN 37167
Estimated Value: $348,266 - $434,000
--
Bed
3
Baths
1,555
Sq Ft
$264/Sq Ft
Est. Value
About This Home
This home is located at 801 Rhett Dr, Smyrna, TN 37167 and is currently estimated at $409,817, approximately $263 per square foot. 801 Rhett Dr is a home located in Rutherford County with nearby schools including Stewarts Creek Elementary School, Stewarts Creek Middle School, and Stewarts Creek High School.
Ownership History
Date
Name
Owned For
Owner Type
Purchase Details
Closed on
Nov 3, 2004
Sold by
Clements Kelly M
Bought by
Relford Robert K and Relford Margaret R
Current Estimated Value
Home Financials for this Owner
Home Financials are based on the most recent Mortgage that was taken out on this home.
Original Mortgage
$131,600
Outstanding Balance
$65,103
Interest Rate
5.65%
Estimated Equity
$344,714
Purchase Details
Closed on
Jul 14, 1999
Sold by
Gail Lawson Laurie
Bought by
Clements Kelly M and Clements She
Home Financials for this Owner
Home Financials are based on the most recent Mortgage that was taken out on this home.
Original Mortgage
$127,700
Interest Rate
7.23%
Purchase Details
Closed on
Jul 14, 1998
Sold by
Lawson William E
Bought by
Gail Lawson Laurie
Purchase Details
Closed on
Sep 30, 1994
Sold by
Hastings Denny Fm Ltd Ptsh
Bought by
Etu Lawson William Michael
Purchase Details
Closed on
Dec 30, 1993
Sold by
Parker & Parks Development
Bought by
Hastings Denny Faily Lp
Create a Home Valuation Report for This Property
The Home Valuation Report is an in-depth analysis detailing your home's value as well as a comparison with similar homes in the area
Home Values in the Area
Average Home Value in this Area
Purchase History
| Date | Buyer | Sale Price | Title Company |
|---|---|---|---|
| Relford Robert K | $164,500 | -- | |
| Clements Kelly M | $141,900 | -- | |
| Gail Lawson Laurie | -- | -- | |
| Etu Lawson William Michael | -- | -- | |
| Hastings Denny Faily Lp | $59,700 | -- |
Source: Public Records
Mortgage History
| Date | Status | Borrower | Loan Amount |
|---|---|---|---|
| Open | Hastings Denny Faily Lp | $131,600 | |
| Previous Owner | Hastings Denny Faily Lp | $127,700 |
Source: Public Records
Tax History Compared to Growth
Tax History
| Year | Tax Paid | Tax Assessment Tax Assessment Total Assessment is a certain percentage of the fair market value that is determined by local assessors to be the total taxable value of land and additions on the property. | Land | Improvement |
|---|---|---|---|---|
| 2025 | -- | $81,150 | $13,750 | $67,400 |
| 2024 | -- | $81,150 | $13,750 | $67,400 |
| 2023 | $1,523 | $81,150 | $13,750 | $67,400 |
| 2022 | $1,284 | $79,425 | $13,750 | $65,675 |
| 2021 | $1,248 | $56,225 | $10,625 | $45,600 |
| 2020 | $1,248 | $56,225 | $10,625 | $45,600 |
| 2019 | $1,248 | $56,225 | $10,625 | $45,600 |
| 2018 | $1,180 | $56,225 | $0 | $0 |
| 2017 | $1,083 | $40,425 | $0 | $0 |
| 2016 | $1,083 | $40,425 | $0 | $0 |
| 2015 | $1,083 | $40,425 | $0 | $0 |
| 2014 | $1,005 | $40,425 | $0 | $0 |
| 2013 | -- | $39,125 | $0 | $0 |
Source: Public Records
Map
Nearby Homes
- 876 Libby St
- 801 Pleasant Run Rd
- 102 Sundown Dr
- 2633 E
- 983 Everett Dr
- 235 Pleasant Run Rd
- 260 Pleasant Run Rd
- 2629 Unitas Drive Lot 21
- 5435 Little Hope Rd
- 2625 Unitas Drive Lot 22
- 2630 Unitas Dr E
- 7309 Pembrooke Farms Dr
- 221 Snapdragon Dr
- 229 Wellington Way
- 1017 Altavista Ln
- 222 Wellington Way
- 7318 Winners Rd
- 2618 Elevation DEF Plan at Brewer Point
- 2131 Elevation DEF Plan at Brewer Point
- 2540 Elevation DEF Plan at Brewer Point
- 803 Rhett Dr
- 811 Rhett Dr
- 718 Rhett Dr
- 714 Rhett Dr
- 806 Rhett Dr
- 815 Rhett Dr
- 710 Rhett Dr
- 709 Rhett Dr
- 706 Rhett Dr
- 819 Rhett Dr
- 436 Pleasant Run Rd
- 808 Emily Dr
- 458 Pleasant Run Rd
- 408 Pleasant Run Rd
- 478 Pleasant Run Rd
- 800 Rhett Dr
- 496 Pleasant Run Rd
- 708 Rhett Dr
- 3451 Stewart Creek Rd
- 370 Pleasant Run Rd