801 S 8th St Burlington, IA 52601
Estimated Value: $63,000 - $92,000
3
Beds
2
Baths
1,511
Sq Ft
$55/Sq Ft
Est. Value
About This Home
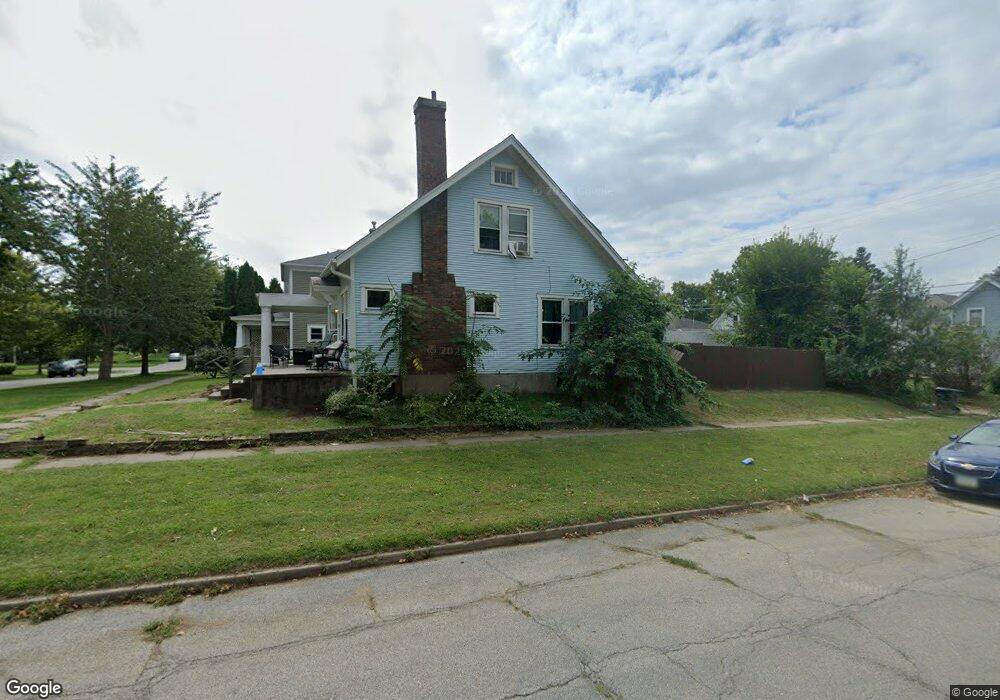
This home is located at 801 S 8th St, Burlington, IA 52601 and is currently estimated at $83,514, approximately $55 per square foot. 801 S 8th St is a home located in Des Moines County with nearby schools including Burlington Community High School, Great River Christian School, and Burlington Notre Dame Catholic Elementary School.
Ownership History
Date
Name
Owned For
Owner Type
Purchase Details
Closed on
Sep 15, 2017
Sold by
Community Development Group Llc
Bought by
Summers Lance E and Oleson Heather N
Current Estimated Value
Purchase Details
Closed on
Dec 21, 2010
Sold by
Senf Michael O and Senf Olga A
Bought by
Summers Lance E
Home Financials for this Owner
Home Financials are based on the most recent Mortgage that was taken out on this home.
Original Mortgage
$49,930
Interest Rate
4.95%
Mortgage Type
Adjustable Rate Mortgage/ARM
Create a Home Valuation Report for This Property
The Home Valuation Report is an in-depth analysis detailing your home's value as well as a comparison with similar homes in the area
Home Values in the Area
Average Home Value in this Area
Purchase History
| Date | Buyer | Sale Price | Title Company |
|---|---|---|---|
| Summers Lance E | $10,900 | None Available | |
| Summers Lance E | $56,500 | -- |
Source: Public Records
Mortgage History
| Date | Status | Borrower | Loan Amount |
|---|---|---|---|
| Previous Owner | Summers Lance E | $49,930 |
Source: Public Records
Tax History Compared to Growth
Tax History
| Year | Tax Paid | Tax Assessment Tax Assessment Total Assessment is a certain percentage of the fair market value that is determined by local assessors to be the total taxable value of land and additions on the property. | Land | Improvement |
|---|---|---|---|---|
| 2025 | $1,383 | $71,600 | $7,100 | $64,500 |
| 2024 | $1,383 | $63,700 | $7,100 | $56,600 |
| 2023 | $1,222 | $63,700 | $7,100 | $56,600 |
| 2022 | $1,242 | $61,000 | $7,100 | $53,900 |
| 2021 | $1,242 | $61,000 | $7,100 | $53,900 |
| 2020 | $1,324 | $61,000 | $7,100 | $53,900 |
| 2019 | $1,288 | $61,000 | $7,100 | $53,900 |
| 2018 | $1,290 | $56,000 | $6,700 | $49,300 |
| 2017 | $1,290 | $53,700 | $0 | $0 |
| 2016 | $5,160 | $53,700 | $0 | $0 |
| 2015 | $1,222 | $53,700 | $0 | $0 |
| 2014 | $1,238 | $65,800 | $0 | $0 |
Source: Public Records
Map
Nearby Homes