Estimated Value: $272,329 - $463,000
--
Bed
1
Bath
864
Sq Ft
$374/Sq Ft
Est. Value
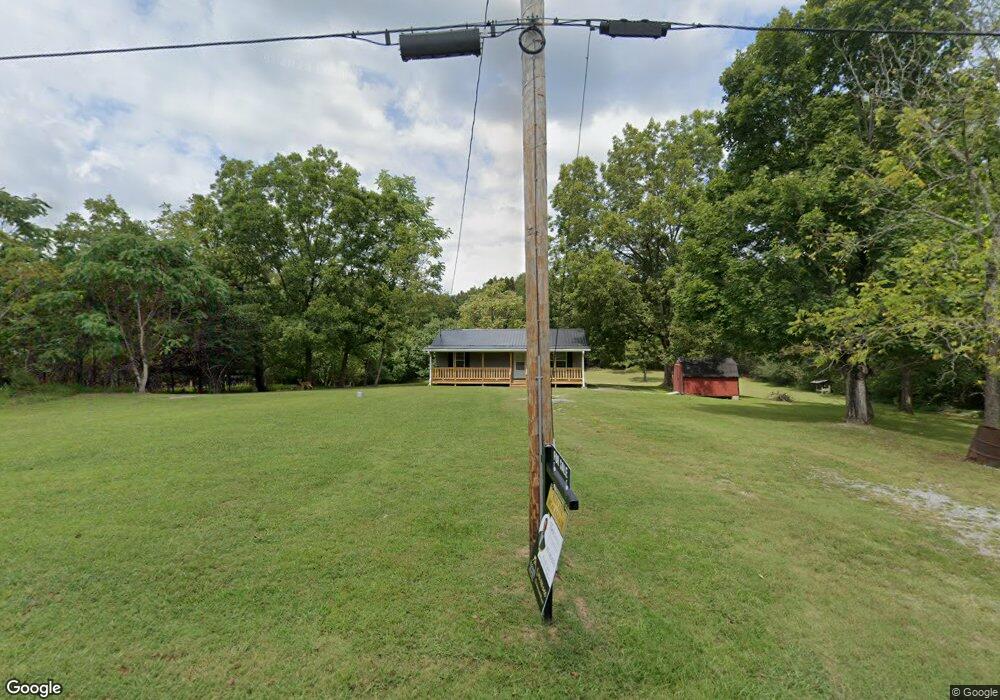
About This Home
This home is located at 801 Stoney Point Mtn Rd, Doyle, TN 38559 and is currently estimated at $323,332, approximately $374 per square foot. 801 Stoney Point Mtn Rd is a home located in Van Buren County with nearby schools including Spencer Elementary School and Van Buren County High School.
Ownership History
Date
Name
Owned For
Owner Type
Purchase Details
Closed on
Jun 6, 2025
Sold by
Hale Anissa Darlene and Dewayne Leonard
Bought by
Zahuranec Kyle H
Current Estimated Value
Home Financials for this Owner
Home Financials are based on the most recent Mortgage that was taken out on this home.
Original Mortgage
$275,000
Outstanding Balance
$274,287
Interest Rate
6.76%
Mortgage Type
New Conventional
Estimated Equity
$49,045
Purchase Details
Closed on
Jan 6, 2012
Bought by
Brymer Phoebe B and Hale Hale
Purchase Details
Closed on
Sep 22, 2011
Sold by
Brymer Phoebe B
Bought by
Brymer William Rufus and Hale Leonard Dewayne
Purchase Details
Closed on
Feb 22, 2005
Sold by
Not Provided
Bought by
Brymer William Rufus and Brymer Phoebe B
Purchase Details
Closed on
Feb 3, 1997
Bought by
Brymer Joe Denny
Purchase Details
Closed on
Jun 12, 1995
Bought by
Brymer Dennie 2 and Int 5
Create a Home Valuation Report for This Property
The Home Valuation Report is an in-depth analysis detailing your home's value as well as a comparison with similar homes in the area
Home Values in the Area
Average Home Value in this Area
Purchase History
| Date | Buyer | Sale Price | Title Company |
|---|---|---|---|
| Zahuranec Kyle H | $275,000 | None Listed On Document | |
| Zahuranec Kyle H | $275,000 | None Listed On Document | |
| Brymer Phoebe B | -- | -- | |
| Brymer William Rufus | -- | -- | |
| Brymer William Rufus | -- | -- | |
| Brymer Joe Denny | $11,000 | -- | |
| Brymer Dennie 2 | -- | -- | |
| Brymer Dennie 1 | -- | -- |
Source: Public Records
Mortgage History
| Date | Status | Borrower | Loan Amount |
|---|---|---|---|
| Open | Zahuranec Kyle H | $275,000 | |
| Closed | Zahuranec Kyle H | $275,000 |
Source: Public Records
Tax History Compared to Growth
Tax History
| Year | Tax Paid | Tax Assessment Tax Assessment Total Assessment is a certain percentage of the fair market value that is determined by local assessors to be the total taxable value of land and additions on the property. | Land | Improvement |
|---|---|---|---|---|
| 2024 | $559 | $23,275 | $7,825 | $15,450 |
| 2023 | $559 | $23,275 | $7,825 | $15,450 |
| 2022 | $559 | $23,275 | $7,825 | $15,450 |
| 2021 | $559 | $23,275 | $7,825 | $15,450 |
| 2020 | $506 | $23,275 | $7,825 | $15,450 |
| 2019 | $424 | $18,350 | $6,000 | $12,350 |
| 2018 | $354 | $18,350 | $6,000 | $12,350 |
| 2017 | $354 | $18,350 | $6,000 | $12,350 |
| 2016 | $354 | $18,350 | $6,000 | $12,350 |
| 2015 | $354 | $18,350 | $6,000 | $12,350 |
| 2014 | $343 | $18,350 | $6,000 | $12,350 |
| 2013 | $343 | $18,713 | $0 | $0 |
Source: Public Records
Map
Nearby Homes
- 1518 Cummingsville and Sparkman Rd
- 88 Hollingsworth Slough Rd
- 4 Barlow Rd
- 0 Topside Dr Unit RTC2915284
- 3598 Biddle Ln
- 3204 Sparkmantown Rd
- 118 Ed Phifer Rd
- 3204 Sparkman Town Rd
- 2148 Topside Dr
- Lot 60 Topside Dr
- 0 Sparkmantown Rd Unit RTC2931549
- 0 Sparkman Town Rd
- 0 Spokelay Rd Unit RTC2980355
- 0 Spokelay Rd Unit 1519241
- 0 Spokelay Rd Unit RTC2946643
- 0 Spokelay Rd Unit RTC2946642
- 0 Spokelay Rd Unit RTC2946641
- 0 Spokelay Rd Unit RTC2946640
- 0 Spokelay Rd Unit RTC2812627
- 0 Spokelay Rd Unit RTC2778447