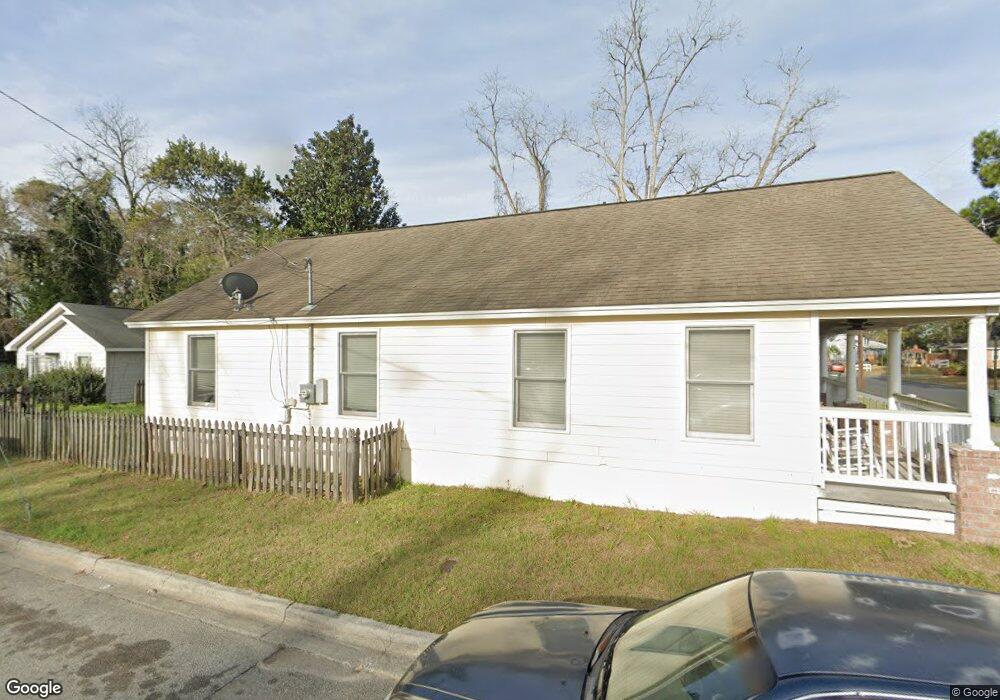
801 W 40th St Savannah, GA 31415
Cuyler-Brownsville NeighborhoodEstimated Value: $240,544 - $276,000
3
Beds
2
Baths
1,320
Sq Ft
$193/Sq Ft
Est. Value
About This Home
This home is located at 801 W 40th St, Savannah, GA 31415 and is currently estimated at $254,886, approximately $193 per square foot. 801 W 40th St is a home located in Chatham County with nearby schools including Derenne Middle School, Beach High School, and Susie King Taylor Community School.
Ownership History
Date
Name
Owned For
Owner Type
Purchase Details
Closed on
Feb 6, 2009
Sold by
Obrien William S
Bought by
True North Corp Trustee
Current Estimated Value
Purchase Details
Closed on
Jun 7, 2007
Sold by
Not Provided
Bought by
Johnson Cooper and Johnson Joseph K
Home Financials for this Owner
Home Financials are based on the most recent Mortgage that was taken out on this home.
Original Mortgage
$93,197
Interest Rate
6.1%
Mortgage Type
FHA
Create a Home Valuation Report for This Property
The Home Valuation Report is an in-depth analysis detailing your home's value as well as a comparison with similar homes in the area
Home Values in the Area
Average Home Value in this Area
Purchase History
| Date | Buyer | Sale Price | Title Company |
|---|---|---|---|
| True North Corp Trustee | -- | -- | |
| Johnson Cooper | $129,900 | -- |
Source: Public Records
Mortgage History
| Date | Status | Borrower | Loan Amount |
|---|---|---|---|
| Previous Owner | Johnson Cooper | $93,197 | |
| Previous Owner | Johnson Cooper | $40,000 |
Source: Public Records
Tax History Compared to Growth
Tax History
| Year | Tax Paid | Tax Assessment Tax Assessment Total Assessment is a certain percentage of the fair market value that is determined by local assessors to be the total taxable value of land and additions on the property. | Land | Improvement |
|---|---|---|---|---|
| 2025 | $2,443 | $108,640 | $15,840 | $92,800 |
| 2024 | $2,443 | $88,160 | $6,520 | $81,640 |
| 2023 | $1,119 | $91,760 | $6,520 | $85,240 |
| 2022 | $615 | $50,440 | $6,520 | $43,920 |
| 2021 | $1,317 | $30,960 | $6,520 | $24,440 |
| 2020 | $1,018 | $32,240 | $2,440 | $29,800 |
| 2019 | $1,432 | $32,240 | $2,440 | $29,800 |
| 2018 | $803 | $25,440 | $2,440 | $23,000 |
| 2017 | $752 | $25,640 | $2,440 | $23,200 |
| 2016 | $740 | $25,360 | $2,440 | $22,920 |
| 2015 | $1,481 | $35,520 | $5,480 | $30,040 |
| 2014 | $1,987 | $35,960 | $0 | $0 |
Source: Public Records
Map
Nearby Homes