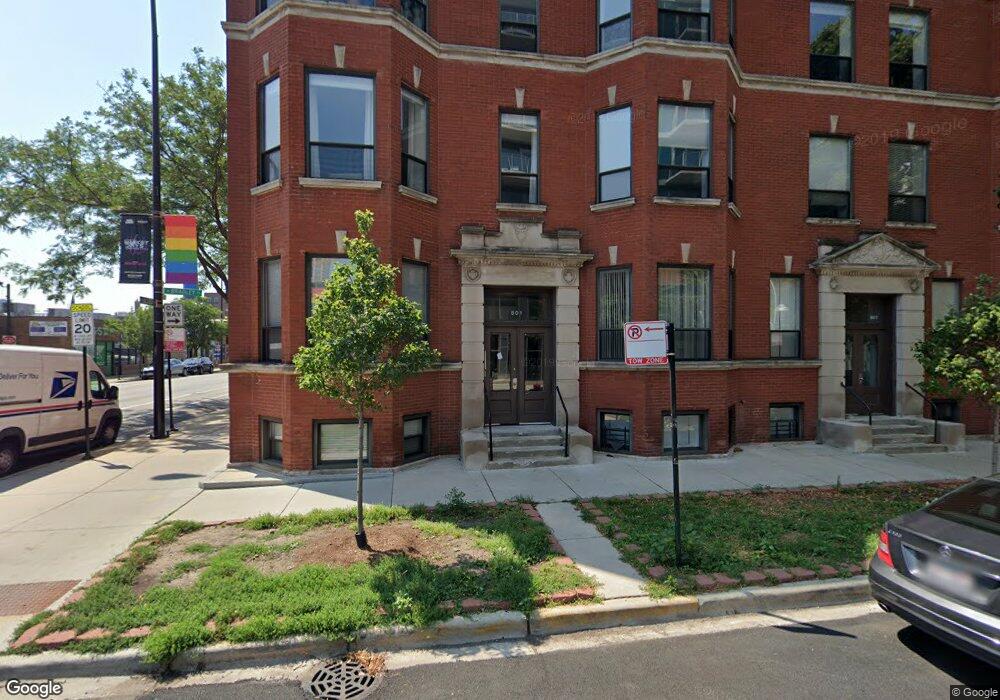
801 W Bradley Place Unit 1 Chicago, IL 60613
Lakeview East NeighborhoodEstimated Value: $402,309 - $544,000
--
Bed
--
Bath
--
Sq Ft
10,803
Sq Ft Lot
About This Home
This home is located at 801 W Bradley Place Unit 1, Chicago, IL 60613 and is currently estimated at $468,077. 801 W Bradley Place Unit 1 is a home located in Cook County with nearby schools including Greeley Elementary School, Lake View High School, and Bernard Zell Anshe Emet Day School.
Ownership History
Date
Name
Owned For
Owner Type
Purchase Details
Closed on
May 31, 2018
Sold by
Murphy Jessica and Murphy Timothy C
Bought by
Strozier Jeffrey Glen and Galloy James F
Current Estimated Value
Home Financials for this Owner
Home Financials are based on the most recent Mortgage that was taken out on this home.
Original Mortgage
$293,550
Outstanding Balance
$257,994
Interest Rate
5.25%
Mortgage Type
New Conventional
Estimated Equity
$210,083
Purchase Details
Closed on
Jul 2, 2007
Sold by
801-11 West Bradley Llc
Bought by
Farella Courtney M and Ferguson Jerry M
Home Financials for this Owner
Home Financials are based on the most recent Mortgage that was taken out on this home.
Original Mortgage
$255,200
Interest Rate
6.25%
Mortgage Type
Purchase Money Mortgage
Create a Home Valuation Report for This Property
The Home Valuation Report is an in-depth analysis detailing your home's value as well as a comparison with similar homes in the area
Home Values in the Area
Average Home Value in this Area
Purchase History
| Date | Buyer | Sale Price | Title Company |
|---|---|---|---|
| Strozier Jeffrey Glen | $309,000 | Chicago Title | |
| Farella Courtney M | $319,000 | Ct |
Source: Public Records
Mortgage History
| Date | Status | Borrower | Loan Amount |
|---|---|---|---|
| Open | Strozier Jeffrey Glen | $293,550 | |
| Previous Owner | Farella Courtney M | $255,200 |
Source: Public Records
Tax History Compared to Growth
Tax History
| Year | Tax Paid | Tax Assessment Tax Assessment Total Assessment is a certain percentage of the fair market value that is determined by local assessors to be the total taxable value of land and additions on the property. | Land | Improvement |
|---|---|---|---|---|
| 2024 | $6,584 | $35,123 | $9,926 | $25,197 |
| 2023 | $6,423 | $29,000 | $8,005 | $20,995 |
| 2022 | $6,423 | $29,000 | $8,005 | $20,995 |
| 2021 | $6,302 | $29,000 | $8,005 | $20,995 |
| 2020 | $6,530 | $27,190 | $3,415 | $23,775 |
| 2019 | $6,405 | $29,618 | $3,415 | $26,203 |
| 2018 | $6,304 | $29,618 | $3,415 | $26,203 |
| 2017 | $6,303 | $27,308 | $2,988 | $24,320 |
| 2016 | $5,852 | $27,308 | $2,988 | $24,320 |
| 2015 | $5,366 | $27,308 | $2,988 | $24,320 |
| 2014 | $5,784 | $28,889 | $2,454 | $26,435 |
| 2013 | $5,676 | $28,889 | $2,454 | $26,435 |
Source: Public Records
Map
Nearby Homes
- 852 W Grace St Unit T
- 3732 N Pine Grove Ave Unit 2A
- 3758 N Fremont St Unit 2
- 3758 N Fremont St Unit 1
- 3723 N Wilton Ave Unit 4
- 3810 N Fremont St Unit 2B
- 3807 N Wilton Ave Unit 3
- 3635 N Wilton Ave Unit 4
- 3638 N Pine Grove Ave Unit G2
- 636 W Waveland Ave Unit 1A
- 3826 N Fremont St Unit 1N
- 630 W Waveland Ave Unit 2A
- 3620 N Pine Grove Ave Unit 504
- 611 W Patterson Ave Unit 317
- 3660 N Lake Shore Dr Unit P-47
- 3660 N Lake Shore Dr Unit P048
- 3660 N Lake Shore Dr Unit 3301
- 3660 N Lake Shore Dr Unit 1015
- 3660 N Lake Shore Dr Unit 1407
- 718 W Sheridan Rd Unit 3S
- 801 W Bradley Place
- 801 W Bradley Place Unit 3
- 801 W Bradley Place Unit 2
- 801 W Bradley Place Unit G
- 801 W Bradley Place
- 801 W Bradley Place
- 801 W Bradley Place
- 801 W Bradley Place Unit 2
- 801 W Bradley Place Unit 1308
- 801 W Bradley Place Unit 1
- 801 W Bradley Place Unit 3
- 805 W Bradley Place Unit 2
- 805 W Bradley Place Unit 3
- 805 W Bradley Place Unit 2
- 805 W Bradley Place Unit 1
- 805 W Bradley Place Unit G
- 805 W Bradley Place
- 805 W Bradley Place
- 805 W Bradley Place Unit 1
- 805 W Bradley Place Unit G