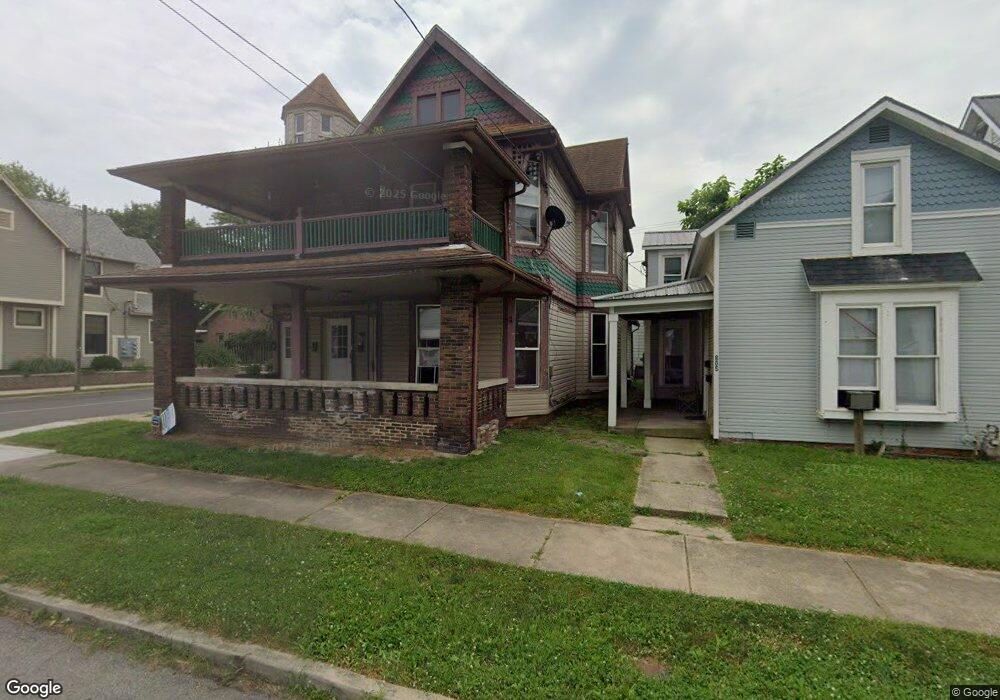
801 W Main St Muncie, IN 47305
Old West End NeighborhoodEstimated Value: $91,000 - $133,000
6
Beds
3
Baths
2,996
Sq Ft
$35/Sq Ft
Est. Value
About This Home
This home is located at 801 W Main St, Muncie, IN 47305 and is currently estimated at $106,000, approximately $35 per square foot. 801 W Main St is a home located in Delaware County with nearby schools including Muncie Central High School, South View Elementary School, and Northside Middle School.
Ownership History
Date
Name
Owned For
Owner Type
Purchase Details
Closed on
Jun 13, 2025
Sold by
Golden Sky Capital Llc-S Series and Golden Sky Capital Llc-S Series 2501 N B
Bought by
White River Real Estate Group Llc
Current Estimated Value
Purchase Details
Closed on
Dec 10, 2024
Sold by
Dure Holdings Llc
Bought by
Gs Holdings 2 Llc
Home Financials for this Owner
Home Financials are based on the most recent Mortgage that was taken out on this home.
Original Mortgage
$208,000
Interest Rate
6.02%
Mortgage Type
Credit Line Revolving
Purchase Details
Closed on
Apr 29, 2022
Sold by
Kissick Austin
Bought by
Dure Holdings Llc
Purchase Details
Closed on
Mar 30, 2020
Sold by
Kissick Jama
Bought by
Kissick Austin
Purchase Details
Closed on
Oct 3, 2007
Sold by
Us Bank National Assn
Bought by
Kissick Carl C
Purchase Details
Closed on
Jul 16, 2007
Sold by
Cox Richard A and Cox Deborah D
Bought by
Us Bank National Association
Create a Home Valuation Report for This Property
The Home Valuation Report is an in-depth analysis detailing your home's value as well as a comparison with similar homes in the area
Home Values in the Area
Average Home Value in this Area
Purchase History
| Date | Buyer | Sale Price | Title Company |
|---|---|---|---|
| White River Real Estate Group Llc | -- | None Listed On Document | |
| Gs Holdings 2 Llc | -- | None Listed On Document | |
| Gs Holdings 2 Llc | -- | None Listed On Document | |
| Dure Holdings Llc | -- | Wesley James R | |
| Kissick Austin | -- | None Available | |
| Kissick Carl C | -- | None Available | |
| Us Bank National Association | -- | None Available |
Source: Public Records
Mortgage History
| Date | Status | Borrower | Loan Amount |
|---|---|---|---|
| Previous Owner | Gs Holdings 2 Llc | $208,000 |
Source: Public Records
Tax History Compared to Growth
Tax History
| Year | Tax Paid | Tax Assessment Tax Assessment Total Assessment is a certain percentage of the fair market value that is determined by local assessors to be the total taxable value of land and additions on the property. | Land | Improvement |
|---|---|---|---|---|
| 2024 | $2,022 | $95,700 | $3,900 | $91,800 |
| 2023 | $1,704 | $79,800 | $3,300 | $76,500 |
| 2022 | $1,620 | $75,600 | $3,300 | $72,300 |
| 2021 | $1,174 | $53,300 | $4,200 | $49,100 |
| 2020 | $1,136 | $51,400 | $4,200 | $47,200 |
| 2019 | $1,136 | $51,400 | $4,200 | $47,200 |
| 2018 | $1,090 | $49,100 | $4,200 | $44,900 |
| 2017 | $1,110 | $50,100 | $4,200 | $45,900 |
| 2016 | $1,110 | $50,100 | $4,200 | $45,900 |
| 2014 | $897 | $42,700 | $4,000 | $38,700 |
| 2013 | -- | $40,900 | $3,900 | $37,000 |
Source: Public Records
Map
Nearby Homes
- 312 S Gharkey St
- 303 S Proud St
- 305 S Proud St
- 725 W Charles St
- 407 W Adams St
- 429 W Charles St
- 502 S Mound St
- 415 W Howard St
- 27 W Orchard Place
- 114 S Walnut St
- 114 S Walnut St Unit 100 & 200
- 709 W Riverside Ave
- 925 W Powers St
- 1024 W Powers St
- 601 W Riverside Ave
- 709 N Wheeling Ave
- 1008 W 1st St
- 1300 W University Ave
- 719 N Mulberry St
- 1319 W Kilgore Ave
- 805 W Main St
- 805 W Main St Unit Muncie
- 710 W Kilgore Ave
- 811 W Main St Unit M
- 811 W Main St
- 811 W Main St Unit 1-5
- 813 W Main St
- 715 W Kilgore Ave
- 815 W Main St
- 721 W Main St
- 817 W Main St Unit 1-6
- 817 W Main St
- 817 W Main St
- 726 W Main St
- 800 W Main St
- 724 W Main St
- 717 W Main St
- 808 W Main St
- 808 W Main St Unit . 1, 2, 3
- 722 W Main St