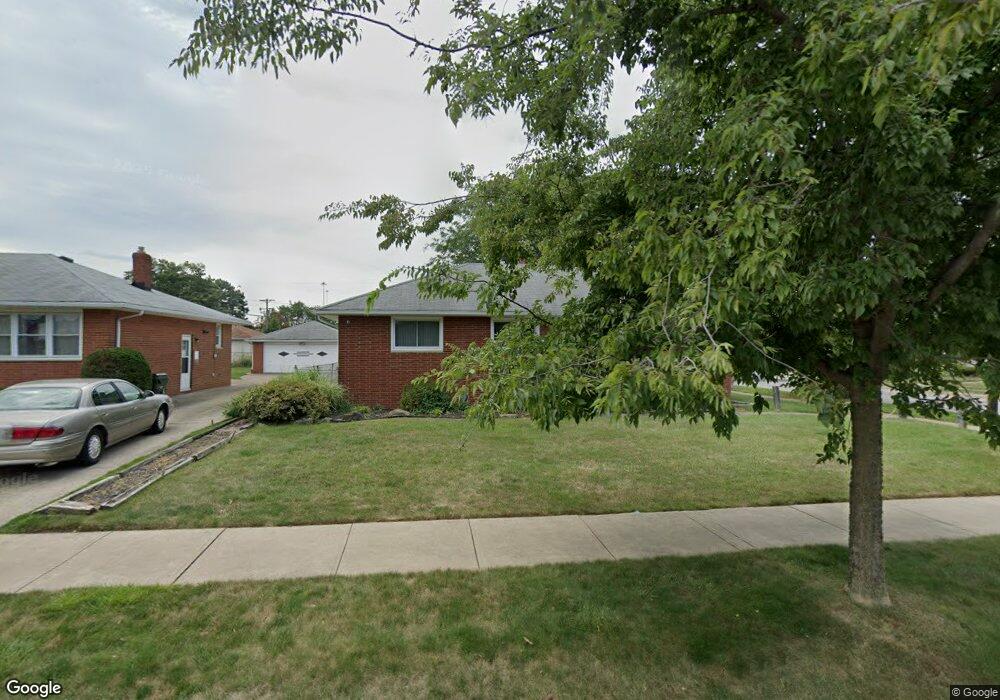
801 Walnut Dr Euclid, OH 44132
Estimated Value: $146,000 - $193,000
3
Beds
1
Bath
1,271
Sq Ft
$135/Sq Ft
Est. Value
About This Home
This home is located at 801 Walnut Dr, Euclid, OH 44132 and is currently estimated at $171,246, approximately $134 per square foot. 801 Walnut Dr is a home located in Cuyahoga County with nearby schools including Shoreview Elementary School, Euclid High School, and Mater Dei Academy.
Ownership History
Date
Name
Owned For
Owner Type
Purchase Details
Closed on
Apr 10, 2001
Sold by
Svete William J and Svete Joyce
Bought by
Henderson Vernall E
Current Estimated Value
Home Financials for this Owner
Home Financials are based on the most recent Mortgage that was taken out on this home.
Original Mortgage
$115,900
Outstanding Balance
$52,026
Interest Rate
9.99%
Estimated Equity
$119,220
Purchase Details
Closed on
Sep 30, 1999
Sold by
Parker Ann S
Bought by
Svete William J
Purchase Details
Closed on
Jun 10, 1986
Sold by
Parker Joseph J and Parker Ann S
Bought by
Parker Ann S
Purchase Details
Closed on
Oct 13, 1983
Sold by
Joseph A Formica
Bought by
Parker Joseph J and Parker Ann S
Purchase Details
Closed on
Sep 21, 1982
Sold by
Formica Joseph A
Bought by
Joseph A Formica
Purchase Details
Closed on
Jul 13, 1977
Sold by
Leonhardt Ronald M and Leonhardt A
Bought by
Formica Joseph A
Purchase Details
Closed on
Jan 1, 1975
Bought by
Leonhardt Ronald M and Leonhardt A
Create a Home Valuation Report for This Property
The Home Valuation Report is an in-depth analysis detailing your home's value as well as a comparison with similar homes in the area
Home Values in the Area
Average Home Value in this Area
Purchase History
| Date | Buyer | Sale Price | Title Company |
|---|---|---|---|
| Henderson Vernall E | $122,000 | Midland Title Security Inc | |
| Svete William J | -- | -- | |
| Parker Ann S | -- | -- | |
| Parker Joseph J | $66,000 | -- | |
| Joseph A Formica | -- | -- | |
| Formica Joseph A | $57,000 | -- | |
| Leonhardt Ronald M | -- | -- |
Source: Public Records
Mortgage History
| Date | Status | Borrower | Loan Amount |
|---|---|---|---|
| Open | Henderson Vernall E | $115,900 |
Source: Public Records
Tax History
| Year | Tax Paid | Tax Assessment Tax Assessment Total Assessment is a certain percentage of the fair market value that is determined by local assessors to be the total taxable value of land and additions on the property. | Land | Improvement |
|---|---|---|---|---|
| 2024 | $3,847 | $56,140 | $9,625 | $46,515 |
| 2023 | $3,932 | $46,030 | $8,540 | $37,490 |
| 2022 | $3,841 | $46,030 | $8,540 | $37,490 |
| 2021 | $4,277 | $46,030 | $8,540 | $37,490 |
| 2020 | $3,584 | $34,860 | $6,480 | $28,390 |
| 2019 | $3,225 | $99,600 | $18,500 | $81,100 |
| 2018 | $3,239 | $34,860 | $6,480 | $28,390 |
| 2017 | $3,496 | $31,290 | $5,180 | $26,110 |
| 2016 | $3,504 | $31,290 | $5,180 | $26,110 |
| 2015 | $7,408 | $31,290 | $5,180 | $26,110 |
| 2014 | $7,408 | $31,290 | $5,180 | $26,110 |
Source: Public Records
Map
Nearby Homes
- 815 E 272nd St
- 730 Hemlock Dr
- 670 Hemlock Dr
- 27190 Zeman Ave
- 597 Hemlock Dr
- 26430 Drakefield Ave
- 591 Hemlock Dr
- 26931 Shoreview Ave
- 26831 Shoreview Ave
- 610 E 266th St
- 26351 Farringdon Ave
- 643 E 261st St
- 27125 Mallard Ave
- 579 E 260th St
- 571 E 260th St
- 25751 Briardale Ave
- 25700 Briardale Ave
- 1354 Craneing Rd
- 440 E 271st St
- 25650 Richards Ave
Your Personal Tour Guide
Ask me questions while you tour the home.