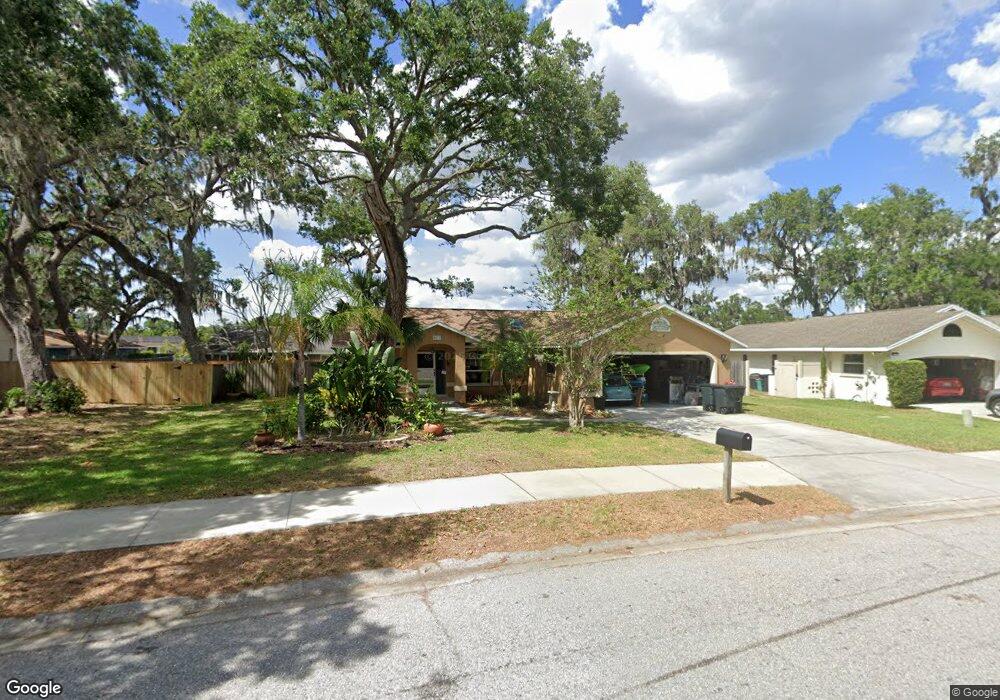
8010 55th St E Palmetto, FL 34221
East Ellenton NeighborhoodEstimated Value: $332,000 - $364,000
3
Beds
2
Baths
1,485
Sq Ft
$237/Sq Ft
Est. Value
About This Home
This home is located at 8010 55th St E, Palmetto, FL 34221 and is currently estimated at $351,902, approximately $236 per square foot. 8010 55th St E is a home located in Manatee County with nearby schools including Virgil Mills Elementary School, Buffalo Creek Middle School, and Palmetto High School.
Ownership History
Date
Name
Owned For
Owner Type
Purchase Details
Closed on
Dec 17, 2016
Sold by
Morris George V and Dean Pameal M
Bought by
Morris George V and Morris Pamela M
Current Estimated Value
Purchase Details
Closed on
Jul 30, 2009
Sold by
Boggess John and Boggess Marguerite
Bought by
Morris George V and Dean Pamela M
Home Financials for this Owner
Home Financials are based on the most recent Mortgage that was taken out on this home.
Original Mortgage
$122,400
Outstanding Balance
$80,414
Interest Rate
5.36%
Mortgage Type
Purchase Money Mortgage
Estimated Equity
$271,488
Purchase Details
Closed on
Jul 29, 2009
Sold by
Boggess Fred C
Bought by
Morris George V and Dean Pamela M
Home Financials for this Owner
Home Financials are based on the most recent Mortgage that was taken out on this home.
Original Mortgage
$122,400
Outstanding Balance
$80,414
Interest Rate
5.36%
Mortgage Type
Purchase Money Mortgage
Estimated Equity
$271,488
Purchase Details
Closed on
Jun 26, 1998
Sold by
Dummer David T and Dummer Joan M
Bought by
Boggess John and Bogges Marguerite
Create a Home Valuation Report for This Property
The Home Valuation Report is an in-depth analysis detailing your home's value as well as a comparison with similar homes in the area
Home Values in the Area
Average Home Value in this Area
Purchase History
| Date | Buyer | Sale Price | Title Company |
|---|---|---|---|
| Morris George V | -- | Attorney | |
| Morris George V | -- | Horizon Title | |
| Morris George V | $145,000 | Horizon Title | |
| Boggess John | $123,000 | -- |
Source: Public Records
Mortgage History
| Date | Status | Borrower | Loan Amount |
|---|---|---|---|
| Open | Morris George V | $122,400 |
Source: Public Records
Tax History
| Year | Tax Paid | Tax Assessment Tax Assessment Total Assessment is a certain percentage of the fair market value that is determined by local assessors to be the total taxable value of land and additions on the property. | Land | Improvement |
|---|---|---|---|---|
| 2025 | $2,549 | $225,247 | -- | -- |
| 2023 | $2,549 | $212,523 | $0 | $0 |
| 2022 | $2,533 | $206,333 | $0 | $0 |
| 2021 | $2,425 | $200,323 | $0 | $0 |
| 2020 | $2,497 | $197,557 | $35,000 | $162,557 |
| 2019 | $2,489 | $195,619 | $0 | $0 |
| 2018 | $2,738 | $172,302 | $25,000 | $147,302 |
| 2017 | $1,973 | $165,995 | $0 | $0 |
| 2016 | $2,361 | $157,583 | $0 | $0 |
Source: Public Records
Map
Nearby Homes
- 5628 82nd Ave E
- 5512 82nd Ave E Unit 3
- 5005 Leon Dr
- 7427 61st St E
- 7303 55th St E
- 8703 59th St E Unit 1
- 5806 Oak Mill Terrace
- 7318 61st St E
- 5539 70th Dr E
- 5910 Oak Mill Terrace
- 5509 69th Place E
- 6112 90th Avenue Cir E
- 8343 47th Street Cir E
- 8348 47th Street Cir E
- 6215 90th Avenue Cir E
- 8023 Buena Vista Dr N
- 7619 Bonita Way
- 7919 Buena Vista Dr N
- 7611 Bonita Way
- 7824 Bonita Way
Your Personal Tour Guide
Ask me questions while you tour the home.