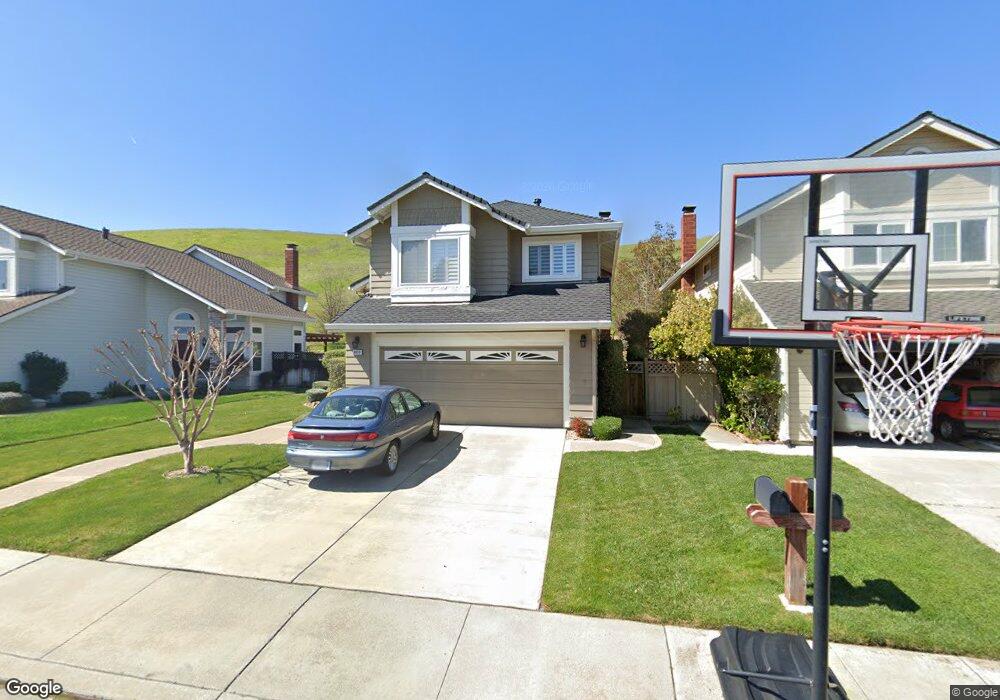
8010 Crossridge Rd Dublin, CA 94568
Estimated Value: $1,538,860 - $1,724,000
4
Beds
3
Baths
2,040
Sq Ft
$802/Sq Ft
Est. Value
About This Home
This home is located at 8010 Crossridge Rd, Dublin, CA 94568 and is currently estimated at $1,636,715, approximately $802 per square foot. 8010 Crossridge Rd is a home located in Alameda County with nearby schools including Frederiksen Elementary School, Wells Middle School, and Dublin High School.
Ownership History
Date
Name
Owned For
Owner Type
Purchase Details
Closed on
Oct 22, 2013
Sold by
Jackson Lennox Raymond and Jackson Bonnie D
Bought by
Jackson Lennox Raymond and Jackson Bonnie D
Current Estimated Value
Home Financials for this Owner
Home Financials are based on the most recent Mortgage that was taken out on this home.
Original Mortgage
$591,000
Outstanding Balance
$444,608
Interest Rate
4.53%
Mortgage Type
New Conventional
Estimated Equity
$1,192,107
Purchase Details
Closed on
Jun 28, 2004
Sold by
Jespersen Steve R and Jespersen Wendy A
Bought by
Jackson Bonnie Dyson
Home Financials for this Owner
Home Financials are based on the most recent Mortgage that was taken out on this home.
Original Mortgage
$543,750
Interest Rate
5.37%
Mortgage Type
Purchase Money Mortgage
Purchase Details
Closed on
Jun 23, 2004
Sold by
Jackson Bonnie Dyson
Bought by
Dyson Jackson Lennox Raymond and Dyson Jackson Bonnie
Home Financials for this Owner
Home Financials are based on the most recent Mortgage that was taken out on this home.
Original Mortgage
$543,750
Interest Rate
5.37%
Mortgage Type
Purchase Money Mortgage
Purchase Details
Closed on
Aug 2, 2001
Sold by
Jespersen Steve R
Bought by
Jespersen Steve R and Jespersen Wendy A
Home Financials for this Owner
Home Financials are based on the most recent Mortgage that was taken out on this home.
Original Mortgage
$397,500
Interest Rate
7.54%
Purchase Details
Closed on
May 13, 2000
Sold by
Jespersen Steve R
Bought by
Jespersen Steve R and Jespersen Wendy A
Home Financials for this Owner
Home Financials are based on the most recent Mortgage that was taken out on this home.
Original Mortgage
$40,600
Interest Rate
8.22%
Mortgage Type
Credit Line Revolving
Purchase Details
Closed on
Dec 17, 1999
Sold by
Hober Mark G and Hober Rochelle M
Bought by
Jespersen Steve R
Home Financials for this Owner
Home Financials are based on the most recent Mortgage that was taken out on this home.
Original Mortgage
$318,800
Interest Rate
4.45%
Purchase Details
Closed on
Oct 28, 1994
Sold by
Hober Mark G and Hober Rochelle Marie
Bought by
Hober Mark G and Hober Rochelle Marie
Purchase Details
Closed on
Jun 16, 1994
Sold by
Schott Barbara E
Bought by
Hober Mark G and Urban Rochelle Marie
Home Financials for this Owner
Home Financials are based on the most recent Mortgage that was taken out on this home.
Original Mortgage
$265,500
Interest Rate
8.25%
Create a Home Valuation Report for This Property
The Home Valuation Report is an in-depth analysis detailing your home's value as well as a comparison with similar homes in the area
Purchase History
| Date | Buyer | Sale Price | Title Company |
|---|---|---|---|
| Jackson Lennox Raymond | -- | None Available | |
| Jackson Bonnie Dyson | $725,000 | Chicago Title Company | |
| Dyson Jackson Lennox Raymond | -- | -- | |
| Jackson Bonnie Dyson | -- | Chicago Title Company | |
| Jespersen Steve R | -- | American Title Co | |
| Jespersen Steve R | -- | American Title Co | |
| Jespersen Steve R | -- | United Title Insurance Co | |
| Jespersen Steve R | -- | United Title Ins Co | |
| Jespersen Steve R | $398,500 | American Title Co | |
| Jespersen Steve R | -- | American Title Co | |
| Hober Mark G | -- | First American Title Guarant | |
| Hober Mark G | $295,000 | First American Title |
Source: Public Records
Mortgage History
| Date | Status | Borrower | Loan Amount |
|---|---|---|---|
| Open | Jackson Lennox Raymond | $591,000 | |
| Closed | Jackson Bonnie Dyson | $543,750 | |
| Previous Owner | Jespersen Steve R | $397,500 | |
| Previous Owner | Jespersen Steve R | $40,600 | |
| Previous Owner | Jespersen Steve R | $318,800 | |
| Previous Owner | Hober Mark G | $265,500 |
Source: Public Records
Tax History
| Year | Tax Paid | Tax Assessment Tax Assessment Total Assessment is a certain percentage of the fair market value that is determined by local assessors to be the total taxable value of land and additions on the property. | Land | Improvement |
|---|---|---|---|---|
| 2025 | $14,039 | $1,023,738 | $309,221 | $721,517 |
| 2024 | $14,039 | $1,003,533 | $303,160 | $707,373 |
| 2023 | $13,889 | $990,718 | $297,215 | $693,503 |
| 2022 | $13,712 | $964,296 | $291,389 | $679,907 |
| 2021 | $13,539 | $945,257 | $285,677 | $666,580 |
| 2020 | $12,647 | $942,500 | $282,750 | $659,750 |
| 2019 | $12,639 | $924,018 | $277,205 | $646,813 |
| 2018 | $12,314 | $905,901 | $271,770 | $634,131 |
| 2017 | $12,203 | $888,138 | $266,441 | $621,697 |
| 2016 | $10,550 | $820,000 | $246,000 | $574,000 |
| 2015 | $10,044 | $796,000 | $238,800 | $557,200 |
| 2014 | $9,163 | $705,000 | $211,500 | $493,500 |
Source: Public Records
Map
Nearby Homes
- 7921 Crossridge Rd
- 7774 Tuscany Dr
- 7674 Tuscany Dr
- 6406 Dijon Way Unit 78
- 7511 Oxford Cir Unit 117
- 9049 Craydon Cir
- 221 Tangerine Ct Unit 16
- 8318 Mulberry Place
- 672 Greylyn Dr
- 7126 Cross Creek Cir Unit D
- 9415 Alcosta Blvd
- 6914 Mansfield Ave
- 3930 Viggo Way
- 3868 Hereford Rd
- 6979 Dublin Meadows St Unit A
- 6971 Dublin Meadows St Unit F
- 7020 Stagecoach Rd Unit G
- 7016 Stagecoach Rd Unit G
- 6986 Stagecoach Rd Unit B
- 34 Elmwood Dr
- 8018 Crossridge Rd
- 8002 Crossridge Rd
- 8026 Crossridge Rd
- 7992 Crossridge Rd
- 8034 Crossridge Rd
- 7980 Crossridge Rd
- 7993 Crossridge Rd
- 8011 Crossridge Rd
- 7981 Crossridge Rd
- 7968 Crossridge Rd
- 8042 Crossridge Rd
- 7969 Crossridge Rd
- 7961 Shady Creek Rd
- 7956 Crossridge Rd
- 8050 Crossridge Rd
- 7957 Crossridge Rd
- 7920 Shady Creek Rd
- 7953 Shady Creek Rd
- 8062 Crossridge Rd
- 7945 Shady Creek Rd
Your Personal Tour Guide
Ask me questions while you tour the home.