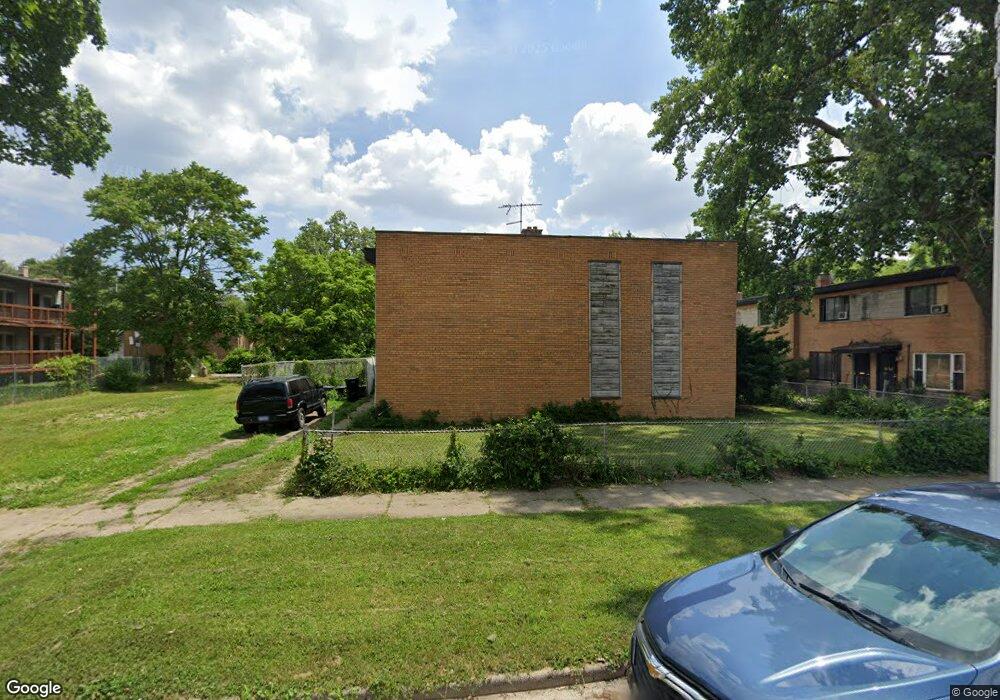
8011 S Union Ave Chicago, IL 60620
Auburn Gresham NeighborhoodEstimated Value: $45,714 - $66,000
2
Beds
1
Bath
581
Sq Ft
$101/Sq Ft
Est. Value
About This Home
This home is located at 8011 S Union Ave, Chicago, IL 60620 and is currently estimated at $58,571, approximately $100 per square foot. 8011 S Union Ave is a home located in Cook County with nearby schools including Westcott Elementary School, Emil G. Hirsch Metropolitan High School, and Community Youth Development Institute.
Ownership History
Date
Name
Owned For
Owner Type
Purchase Details
Closed on
May 17, 2023
Sold by
El Posh Estate Llc
Bought by
Clover Kimberly
Current Estimated Value
Purchase Details
Closed on
Oct 7, 2022
Sold by
Powell Lavonte
Bought by
El Posh Estate Llc
Purchase Details
Closed on
Mar 8, 2021
Sold by
Turner La Ferria and Estate Of Ronald Scott
Bought by
Powell Lavonte
Purchase Details
Closed on
Jan 26, 2015
Sold by
Scott Ronald
Bought by
Scott Ronald
Purchase Details
Closed on
Dec 12, 2014
Sold by
Turner Laferria
Bought by
Scott Ronald
Purchase Details
Closed on
Mar 20, 2012
Sold by
Green Clover Property Llc
Bought by
Mcleod Joel E and Mcleod Eva M
Purchase Details
Closed on
Sep 13, 2011
Sold by
Go Invest Wisely Llc
Bought by
Green Clover Property Llc
Purchase Details
Closed on
Jun 28, 2008
Sold by
Deutsche Bank National Trust Company
Bought by
Go Invest Wisely Llc
Create a Home Valuation Report for This Property
The Home Valuation Report is an in-depth analysis detailing your home's value as well as a comparison with similar homes in the area
Home Values in the Area
Average Home Value in this Area
Purchase History
| Date | Buyer | Sale Price | Title Company |
|---|---|---|---|
| Clover Kimberly | -- | Chicago Title | |
| El Posh Estate Llc | -- | None Listed On Document | |
| Powell Lavonte | $15,000 | Premier Title | |
| Scott Ronald | -- | None Available | |
| Scott Ronald | -- | None Available | |
| Mcleod Joel E | -- | None Available | |
| Green Clover Property Llc | $124 | None Available | |
| Go Invest Wisely Llc | -- | None Available |
Source: Public Records
Tax History Compared to Growth
Tax History
| Year | Tax Paid | Tax Assessment Tax Assessment Total Assessment is a certain percentage of the fair market value that is determined by local assessors to be the total taxable value of land and additions on the property. | Land | Improvement |
|---|---|---|---|---|
| 2024 | $422 | $4,400 | $763 | $3,637 |
| 2023 | $411 | $2,001 | $1,145 | $856 |
| 2022 | $411 | $2,001 | $1,145 | $856 |
| 2021 | $402 | $1,999 | $1,144 | $855 |
| 2020 | $1,435 | $6,440 | $1,144 | $5,296 |
| 2019 | $1,422 | $7,077 | $1,144 | $5,933 |
| 2018 | $1,398 | $7,077 | $1,144 | $5,933 |
| 2017 | $1,112 | $5,164 | $991 | $4,173 |
| 2016 | $1,034 | $5,164 | $991 | $4,173 |
| 2015 | $946 | $5,164 | $991 | $4,173 |
| 2014 | $771 | $4,153 | $915 | $3,238 |
| 2013 | $755 | $4,153 | $915 | $3,238 |
Source: Public Records
Map
Nearby Homes
- 639 W 80th St
- 652 W 81st St
- 705 W 81st St
- 7924 S Lowe Ave
- 8027 S Green St
- 7912 S Parnell Ave
- 503 W 81st St
- 8144 S Green St
- 507 W 79th St
- 7815 S Emerald Ave
- 8022 S Peoria St
- 517 W Winneconna Pkwy
- 8125 S Peoria St
- 7926 S Peoria St
- 8019 S Sangamon St
- 8037 S Sangamon St
- 7955 S Sangamon St
- 414 W 79th Place
- 8224 S Vincennes Ave
- 8153 S Sangamon St
- 8011 S Union Ave
- 8011 S Union Ave
- 8011 S Union Ave
- 8011 S Union Ave
- 8011 S Union Ave
- 8011 S Union Ave
- 8011 S Union Ave Unit A
- 8011 S Union Ave Unit E
- 8019 S Union Ave Unit F
- 8019 S Union Ave
- 8019 S Union Ave
- 8019 S Union Ave
- 8019 S Union Ave
- 8019 S Union Ave
- 8019 S Union Ave
- 8019 S Union Ave
- 8007 S Union Ave
- 645 W 80th St
- 8001 S Union Ave
- 637 W 80th St