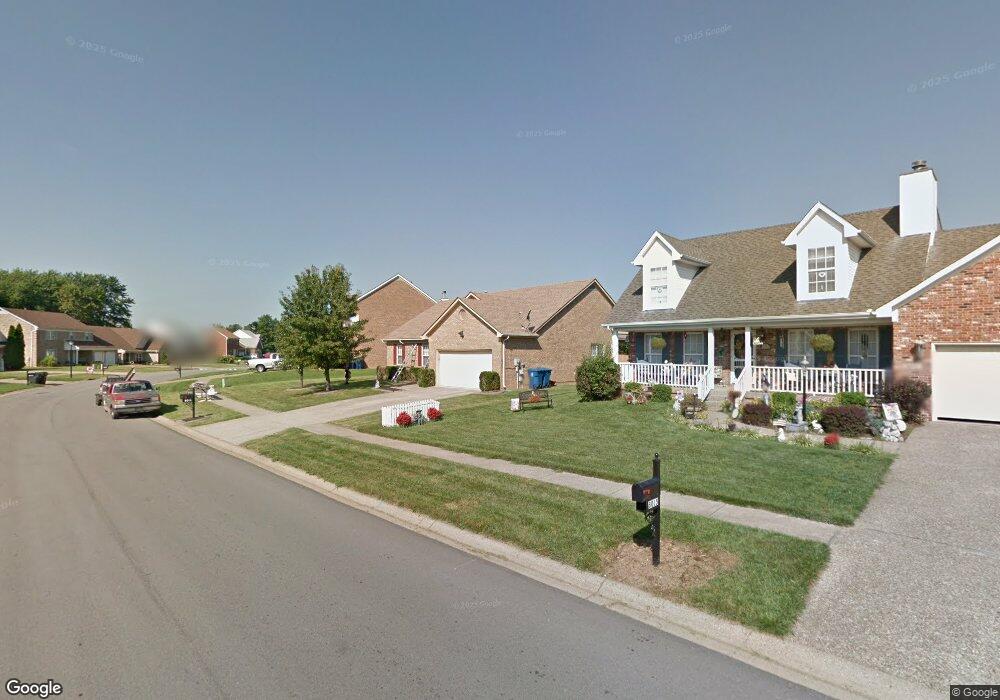
8013 Adams Run Rd Louisville, KY 40228
Estimated Value: $310,000 - $320,000
3
Beds
2
Baths
1,716
Sq Ft
$183/Sq Ft
Est. Value
About This Home
This home is located at 8013 Adams Run Rd, Louisville, KY 40228 and is currently estimated at $314,646, approximately $183 per square foot. 8013 Adams Run Rd is a home located in Jefferson County with nearby schools including Wilt Elementary School, Bates Elementary School, and Wheeler Elementary School.
Ownership History
Date
Name
Owned For
Owner Type
Purchase Details
Closed on
Jun 5, 2024
Sold by
Willingham Michael and Willingham Mary Ann
Bought by
Willingham Janita Caroline and Willingham Chris
Current Estimated Value
Home Financials for this Owner
Home Financials are based on the most recent Mortgage that was taken out on this home.
Original Mortgage
$282,966
Outstanding Balance
$279,457
Interest Rate
7.17%
Mortgage Type
FHA
Estimated Equity
$35,189
Purchase Details
Closed on
Mar 30, 2005
Sold by
Ncn Properties Llc
Bought by
Willingham Michael and Willingham Mary Ann
Home Financials for this Owner
Home Financials are based on the most recent Mortgage that was taken out on this home.
Original Mortgage
$138,720
Interest Rate
5.74%
Mortgage Type
Purchase Money Mortgage
Create a Home Valuation Report for This Property
The Home Valuation Report is an in-depth analysis detailing your home's value as well as a comparison with similar homes in the area
Home Values in the Area
Average Home Value in this Area
Purchase History
| Date | Buyer | Sale Price | Title Company |
|---|---|---|---|
| Willingham Janita Caroline | $309,000 | Acuity Title | |
| Willingham Janita Caroline | $309,000 | Acuity Title | |
| Willingham Michael | $173,400 | Collier Title |
Source: Public Records
Mortgage History
| Date | Status | Borrower | Loan Amount |
|---|---|---|---|
| Open | Willingham Janita Caroline | $282,966 | |
| Closed | Willingham Janita Caroline | $282,966 | |
| Previous Owner | Willingham Michael | $138,720 |
Source: Public Records
Tax History Compared to Growth
Tax History
| Year | Tax Paid | Tax Assessment Tax Assessment Total Assessment is a certain percentage of the fair market value that is determined by local assessors to be the total taxable value of land and additions on the property. | Land | Improvement |
|---|---|---|---|---|
| 2024 | $1,694 | $194,310 | $38,000 | $156,310 |
| 2023 | $1,743 | $194,310 | $38,000 | $156,310 |
| 2022 | $1,818 | $203,720 | $40,000 | $163,720 |
| 2021 | $2,082 | $203,720 | $40,000 | $163,720 |
| 2020 | $1,952 | $203,720 | $40,000 | $163,720 |
| 2019 | $1,782 | $203,720 | $40,000 | $163,720 |
| 2018 | $1,778 | $203,720 | $40,000 | $163,720 |
| 2017 | $1,743 | $203,720 | $40,000 | $163,720 |
| 2013 | $1,734 | $173,400 | $37,000 | $136,400 |
Source: Public Records
Map
Nearby Homes
- 7408 Mayrow Dr
- 8115 Arbor Brook Ln Unit 81
- 8303 Fairmount Rd
- 8309 Fairmount Rd
- 8304 Fairmount Rd
- 8311 Fairmount Rd
- 8412 Arbor Meadow Way Unit 91
- 8308 Fairmount Rd
- 8431 Arbor Meadow Way
- 9727 Hunting Ground Ct
- 9730 Hunting Ground Ct
- 8201 Damascus Rd
- 8802 Fairmount Cove Place
- 8702 Pitch Pine Way
- Lot 2 Fairmount Cove
- 8905 Amaranth Dr
- 9801 Big Boulder Place
- 8114 Cedar Meadows Ln
- 9102 Rocky Bank Ct
- 8109 Cedar Meadows Ln
- 8011 Adams Run Rd
- 8015 Adams Run Rd
- 8912 Adams Run Ct
- 8009 Adams Run Rd
- 8910 Adams Run Ct
- 8017 Adams Run Rd
- 8016 Adams Run Rd
- 8014 Adams Run Rd
- 8018 Adams Run Rd
- 8908 Adams Run Ct
- 8007 Adams Run Rd
- 8012 Adams Run Rd
- 8020 Adams Run Rd
- 8010 Adams Run Rd
- 8022 Adams Run Rd
- 8008 Adams Run Rd
- 8906 Adams Run Ct
- 8911 Adams Run Ct
- 8909 Adams Run Ct
- 8913 Adams Run Ct