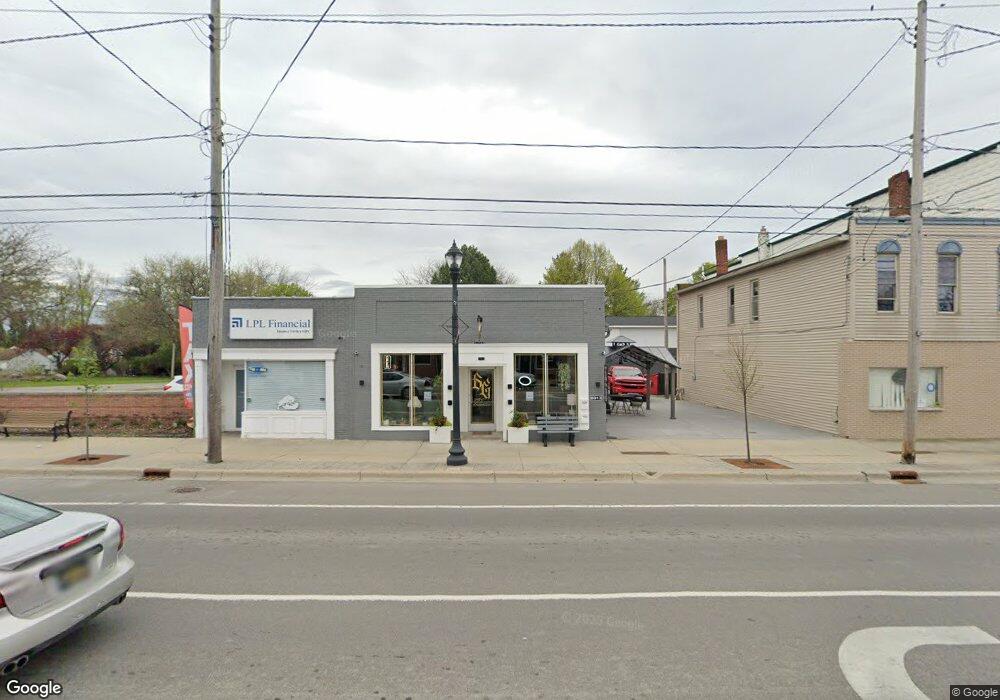
8013 Miller Rd Unit B Swartz Creek, MI 48473
Estimated Value: $220,574
--
Bed
--
Bath
2,125
Sq Ft
$104/Sq Ft
Est. Value
About This Home
This home is located at 8013 Miller Rd Unit B, Swartz Creek, MI 48473 and is currently estimated at $220,574, approximately $103 per square foot. 8013 Miller Rd Unit B is a home located in Genesee County with nearby schools including Syring Elementary School, Elms Road Elementary School, and Morrish Elementary School.
Ownership History
Date
Name
Owned For
Owner Type
Purchase Details
Closed on
Oct 13, 2023
Sold by
Lockhart Real Estate Holdings Llc
Bought by
8013 Miller Rd Llc
Current Estimated Value
Purchase Details
Closed on
Oct 14, 2021
Sold by
Mlpb Llc
Bought by
Lockhart Real Estate Holdings Llc
Purchase Details
Closed on
Feb 17, 2017
Sold by
Briegel Lisa and The Estate Of Pietro Montini
Bought by
Mlpb Llc
Purchase Details
Closed on
Sep 21, 2016
Sold by
Wiggins William G and Wiggins Leola Laverne
Bought by
Montini Pietro
Purchase Details
Closed on
May 3, 2016
Sold by
Montini Marlene F
Bought by
Montini Pietro
Purchase Details
Closed on
Aug 5, 2004
Sold by
Montini Marlene F
Bought by
Montini Peitro
Create a Home Valuation Report for This Property
The Home Valuation Report is an in-depth analysis detailing your home's value as well as a comparison with similar homes in the area
Home Values in the Area
Average Home Value in this Area
Purchase History
| Date | Buyer | Sale Price | Title Company |
|---|---|---|---|
| 8013 Miller Rd Llc | $200,000 | Liberty Title | |
| Lockhart Real Estate Holdings Llc | $62,500 | Liberty Title | |
| Mlpb Llc | -- | None Available | |
| Montini Pietro | -- | None Available | |
| Montini Pietro | -- | None Available | |
| Montini Peitro | -- | -- |
Source: Public Records
Tax History Compared to Growth
Tax History
| Year | Tax Paid | Tax Assessment Tax Assessment Total Assessment is a certain percentage of the fair market value that is determined by local assessors to be the total taxable value of land and additions on the property. | Land | Improvement |
|---|---|---|---|---|
| 2025 | $6,689 | $103,900 | $0 | $0 |
| 2024 | $5,764 | $101,400 | $0 | $0 |
| 2023 | $4,128 | $81,500 | $0 | $0 |
| 2022 | $4,587 | $69,100 | $0 | $0 |
| 2021 | $4,666 | $70,300 | $0 | $0 |
| 2020 | $4,042 | $72,300 | $0 | $0 |
| 2019 | $3,982 | $69,300 | $0 | $0 |
| 2018 | $5,352 | $106,000 | $0 | $0 |
| 2017 | $3,327 | $106,000 | $0 | $0 |
| 2016 | $3,298 | $104,900 | $0 | $0 |
| 2015 | $2,756 | $99,400 | $0 | $0 |
| 2014 | $2,319 | $97,200 | $0 | $0 |
| 2012 | -- | $97,500 | $17,500 | $80,000 |
Source: Public Records
Map
Nearby Homes
- 5032 Brady St
- V/L Morrish Rd
- 5200 Morrish Rd
- 7510 Elizabeth Ct Unit 55
- 8247 Miller Rd
- 4534 Raubinger Rd
- 5108 Mclain St
- 5050 Fairchild St
- 7257 Miller Rd
- 8415 Cappy Ln
- 138 Ashley Cir
- 5402 Raubinger Rd
- 72 Ashley Cir
- 71 Sangam Place
- 4062 Morrish Rd
- 8571 Miller Rd
- V/L Miller Rd
- 7191 Parkridge Pkwy
- 7317 Bristol Rd
- 162 Brookfield
- 8013 Miller Rd
- 5017 Holland Dr Unit Bldg-Unit
- 5017 Holland Dr
- 8012 Miller Rd
- 5023 Holland Dr
- 8097 Sunset Dr
- 7589 Miller Rd
- 7594 Miller Rd
- 5012 Holland Dr
- 5018 Holland Dr
- 4505 Morrish Rd
- 4501 Morrish Rd
- 5026 1st St
- 4500 Morrish Rd
- 7582 Miller Rd
- 5026 Holland Dr
- 5030 1st St
- 8053 Miller Rd
- 5032 Holland Dr
- 7508 Wade St