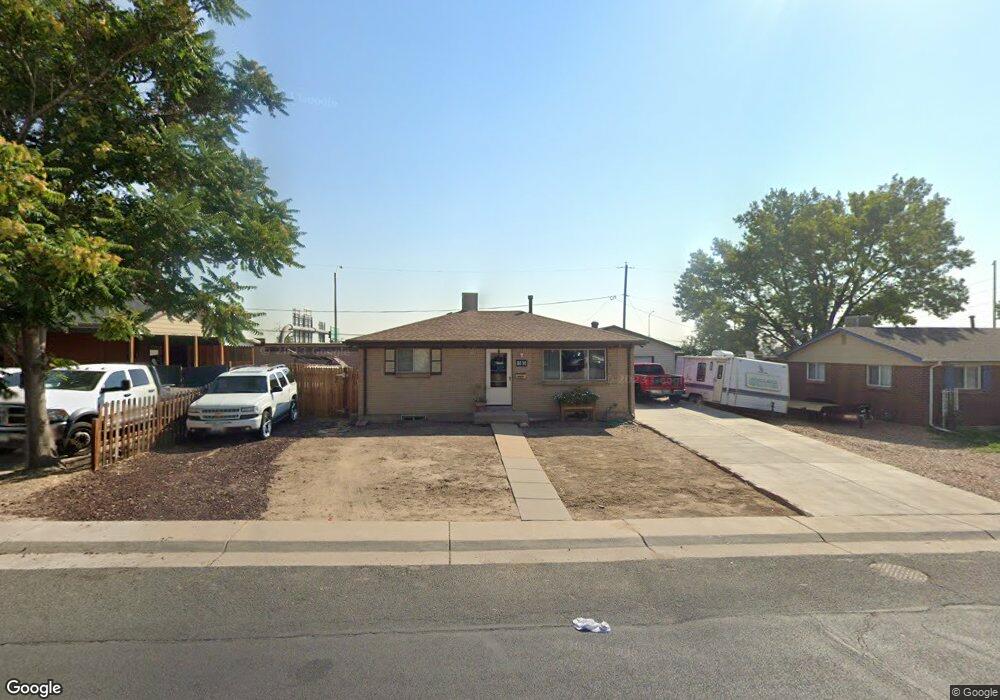
8014 Sherman St Denver, CO 80221
Sherrelwood NeighborhoodEstimated Value: $390,000 - $404,000
2
Beds
1
Bath
792
Sq Ft
$500/Sq Ft
Est. Value
About This Home
This home is located at 8014 Sherman St, Denver, CO 80221 and is currently estimated at $395,810, approximately $499 per square foot. 8014 Sherman St is a home located in Adams County with nearby schools including Coronado Hills Elementary School, Thornton Middle School, and Thornton High School.
Ownership History
Date
Name
Owned For
Owner Type
Purchase Details
Closed on
Jan 12, 2021
Sold by
Stern Ricki W
Bought by
Olmos Carlos Anthony
Current Estimated Value
Home Financials for this Owner
Home Financials are based on the most recent Mortgage that was taken out on this home.
Original Mortgage
$13,353
Outstanding Balance
$11,949
Interest Rate
2.73%
Mortgage Type
New Conventional
Estimated Equity
$383,861
Purchase Details
Closed on
Dec 15, 2003
Sold by
Hud
Bought by
Stern Ricki W
Home Financials for this Owner
Home Financials are based on the most recent Mortgage that was taken out on this home.
Original Mortgage
$91,341
Interest Rate
6.02%
Mortgage Type
FHA
Purchase Details
Closed on
Nov 19, 1999
Sold by
And Dye Louis E and Dye Madelyn A
Bought by
Pinon Vicente and Martinez Elizabeth
Home Financials for this Owner
Home Financials are based on the most recent Mortgage that was taken out on this home.
Original Mortgage
$145,085
Interest Rate
7.83%
Mortgage Type
FHA
Create a Home Valuation Report for This Property
The Home Valuation Report is an in-depth analysis detailing your home's value as well as a comparison with similar homes in the area
Home Values in the Area
Average Home Value in this Area
Purchase History
| Date | Buyer | Sale Price | Title Company |
|---|---|---|---|
| Olmos Carlos Anthony | $340,000 | None Available | |
| Stern Ricki W | -- | -- | |
| Pinon Vicente | $147,000 | Land Title |
Source: Public Records
Mortgage History
| Date | Status | Borrower | Loan Amount |
|---|---|---|---|
| Open | Olmos Carlos Anthony | $13,353 | |
| Open | Olmos Carlos Anthony | $333,841 | |
| Previous Owner | Stern Ricki W | $91,341 | |
| Previous Owner | Pinon Vicente | $145,085 |
Source: Public Records
Tax History Compared to Growth
Tax History
| Year | Tax Paid | Tax Assessment Tax Assessment Total Assessment is a certain percentage of the fair market value that is determined by local assessors to be the total taxable value of land and additions on the property. | Land | Improvement |
|---|---|---|---|---|
| 2024 | $2,534 | $24,060 | $5,500 | $18,560 |
| 2023 | $2,514 | $26,650 | $5,610 | $21,040 |
| 2022 | $2,571 | $21,340 | $5,770 | $15,570 |
| 2021 | $2,571 | $21,340 | $5,770 | $15,570 |
| 2020 | $2,560 | $21,040 | $5,930 | $15,110 |
| 2019 | $2,562 | $21,040 | $5,930 | $15,110 |
| 2018 | $2,068 | $16,390 | $5,400 | $10,990 |
| 2017 | $1,899 | $16,390 | $5,400 | $10,990 |
| 2016 | $1,473 | $12,240 | $2,950 | $9,290 |
| 2015 | $1,472 | $12,240 | $2,950 | $9,290 |
| 2014 | $1,265 | $10,770 | $2,390 | $8,380 |
Source: Public Records
Map
Nearby Homes
- 7950 Patricia Dr
- 7856 Joan Dr
- 264 Leona Dr
- 8205 Pennsylvania St
- 261 Elbert Way
- 500 E 83rd Dr
- 7815 Conifer Rd
- 8144 Washington St Unit 192
- 8298 Cherokee St
- 8124 Washington St Unit 162
- 8156 Washington St Unit 54
- 8156 Washington St Unit 55
- 8136 Washington St Unit 141
- 521 W 78th Place
- 7609 Sherman Place
- 8236 Washington St Unit 28
- 8176 Washington St Unit 113
- 855 E 78th Ave Unit 30
- 7600 Acoma Ct
- 8040 Ogden St
- 8024 Sherman St
- 8004 Sherman St
- 8034 Sherman St
- 8025 Sherman St
- 191 E 80th Ave
- 8044 Sherman St
- 8066 Sherman Way
- 7986 Sherman St
- 8026 Sherman Way
- 7995 Sherman St
- 8006 Sherman Way
- 8046 Sherman Way
- 8054 Sherman St
- 7976 Sherman St
- 7985 Sherman St
- 7994 Sherman Way
- 8065 Sherman St
- 7966 Sherman St
- 8064 Sherman St
- 7975 Sherman St