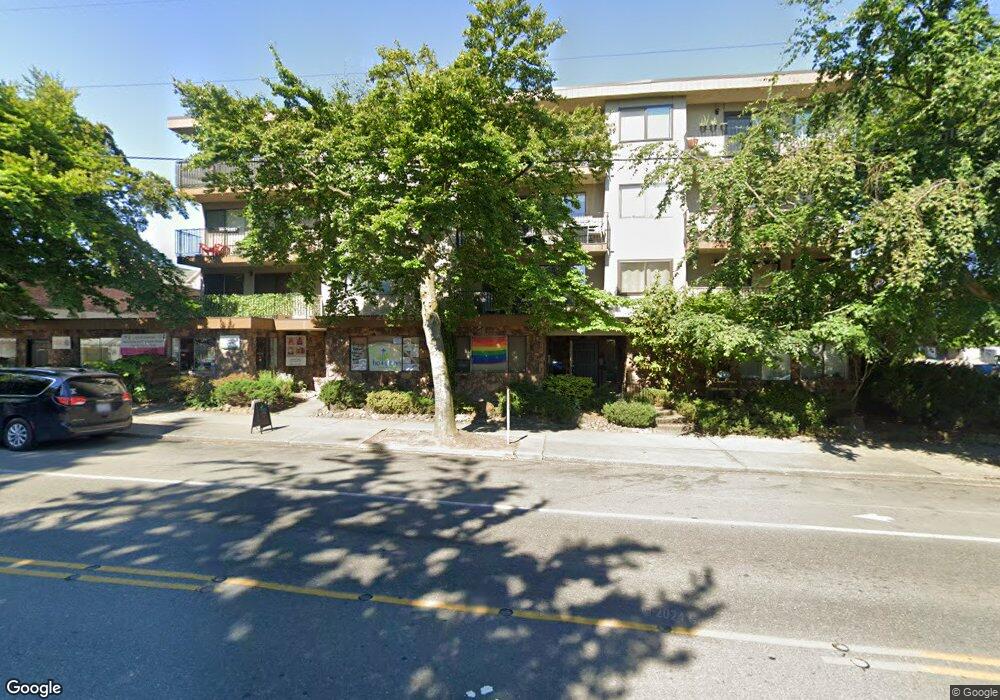
8015 Greenwood Ave N Unit 305 Seattle, WA 98103
Greenwood NeighborhoodEstimated Value: $362,900 - $495,000
1
Bed
1
Bath
700
Sq Ft
$591/Sq Ft
Est. Value
About This Home
This home is located at 8015 Greenwood Ave N Unit 305, Seattle, WA 98103 and is currently estimated at $413,975, approximately $591 per square foot. 8015 Greenwood Ave N Unit 305 is a home located in King County with nearby schools including Greenwood Elementary School, Robert Eagle Staff Middle School, and Ballard High School.
Ownership History
Date
Name
Owned For
Owner Type
Purchase Details
Closed on
Oct 17, 2006
Sold by
Day Stephen M
Bought by
Kornreich Louise J
Current Estimated Value
Home Financials for this Owner
Home Financials are based on the most recent Mortgage that was taken out on this home.
Original Mortgage
$117,399
Outstanding Balance
$70,054
Interest Rate
6.46%
Mortgage Type
Commercial
Estimated Equity
$343,921
Purchase Details
Closed on
May 13, 2002
Sold by
Hern Jerry
Bought by
Day Stephen M
Home Financials for this Owner
Home Financials are based on the most recent Mortgage that was taken out on this home.
Original Mortgage
$115,600
Interest Rate
7.13%
Mortgage Type
Commercial
Purchase Details
Closed on
Aug 3, 1998
Sold by
Berman Morris
Bought by
Hern Jerry
Create a Home Valuation Report for This Property
The Home Valuation Report is an in-depth analysis detailing your home's value as well as a comparison with similar homes in the area
Home Values in the Area
Average Home Value in this Area
Purchase History
| Date | Buyer | Sale Price | Title Company |
|---|---|---|---|
| Kornreich Louise J | $226,500 | First American | |
| Day Stephen M | $144,500 | Transnation Title Insurance | |
| Hern Jerry | $102,000 | Fidelity National Title |
Source: Public Records
Mortgage History
| Date | Status | Borrower | Loan Amount |
|---|---|---|---|
| Open | Kornreich Louise J | $117,399 | |
| Previous Owner | Day Stephen M | $115,600 | |
| Closed | Day Stephen M | $21,675 |
Source: Public Records
Tax History Compared to Growth
Tax History
| Year | Tax Paid | Tax Assessment Tax Assessment Total Assessment is a certain percentage of the fair market value that is determined by local assessors to be the total taxable value of land and additions on the property. | Land | Improvement |
|---|---|---|---|---|
| 2024 | $3,355 | $349,000 | $149,200 | $199,800 |
| 2023 | $2,922 | $353,000 | $149,200 | $203,800 |
| 2022 | $3,089 | $344,000 | $146,200 | $197,800 |
| 2021 | $3,383 | $336,000 | $140,100 | $195,900 |
| 2020 | $3,827 | $351,000 | $134,000 | $217,000 |
| 2018 | $2,913 | $373,000 | $94,400 | $278,600 |
| 2017 | $2,452 | $295,000 | $79,100 | $215,900 |
| 2016 | $2,241 | $256,000 | $70,000 | $186,000 |
| 2015 | $2,007 | $228,000 | $60,900 | $167,100 |
| 2014 | -- | $211,000 | $54,800 | $156,200 |
| 2013 | -- | $166,000 | $51,700 | $114,300 |
Source: Public Records
Map
Nearby Homes
- 120 N 80th St
- 8214 Greenwood Ave N
- 509 N 78th St
- 511 N 78th St
- 8007 Fremont Ave N
- 424 N 85th St Unit 411
- 600 N 85th St Unit 204
- 727 N 81st St
- 359 N 75th St
- 737 N 80th St
- 735 N 83rd St
- 8547 Evanston Ave N
- 326 -330 NW 85th St
- 719 N 85th St
- 317 NW 86th St
- 754 N 82nd St
- 727 N 85th St Unit 102
- 8710 Dayton Ave N
- 604 NW 77th St Unit D
- 8729 Palatine Ave N
- 8015 Greenwood Ave N Unit 401
- 8015 Greenwood Ave N Unit 204
- 8015 Greenwood Ave N Unit 202
- 8015 Greenwood Ave N Unit 205
- 8015 Greenwood Ave N Unit 402
- 8015 Greenwood Ave N Unit 405
- 8015 Greenwood Ave N Unit 301
- 8015 Greenwood Ave N Unit 203
- 8015 Greenwood Ave N Unit 302
- 8015 Greenwood Ave N Unit 303
- 8015 Greenwood Ave N Unit 403
- 8015 Greenwood Ave N Unit 201
- 8015 Greenwood Ave N Unit 304
- 8015 Greenwood Ave N Unit 101
- 8015 Greenwood Ave N
- 145 N 81st St
- 141 N 81st St
- 146 N 80th St
- 8103 Greenwood Ave N
- 142 N 80th St